187 Online Advertising Statistics: Privacy, In-App, PPC, Social and More
Online advertising statistics can help you execute and manage a much more effective digital marketing campaign.
While you should be tracking and analyzing your data based on previous campaigns, relevant advertising stats can offer valuable insights about your target audience’s behavior, help identify trends, interpret algorithms, and make data-driven decisions to optimize your campaigns.
In this article, we will dive into the world of online advertising, including general online advertising, video advertising, social media advertising, and more.
TABLE OF CONTENTS:
- General Online Advertising Statistics
- PPC Statistics
- E-Commerce Advertising Statistics
- Video Advertising Statistics
- Audio Advertising Statistics
- Mobile Advertising Statistics
- Influencer Advertising Statistics
- Display Advertising Statistics
- Social Media Advertising Statistics
- In-App Advertising Statistics
- Privacy and Trust Advertising Statistics
- Use These Online Advertising Statistics to Plan Your Campaign
General Online Advertising Statistics
- There are 4.95 billion internet users. (Influencer Marketing Hub)
- Global digital advertising spend amounted to over $600 billion in 2022. (Influencer Marketing Hub)
- Digital advertising spending will grow to over $870 billion by 2026. (Influencer Marketing Hub)
- Global internet advertising is expected to see a CAGR of 17.2% from 2020 to 2027. (Allied Market Research)
- Large enterprises have a larger global digital ad spend than SMBs. (Allied Market Research)
- US adults spend an average of 7 hours and 50 minutes consuming digital media. (Influencer Marketing Hub)
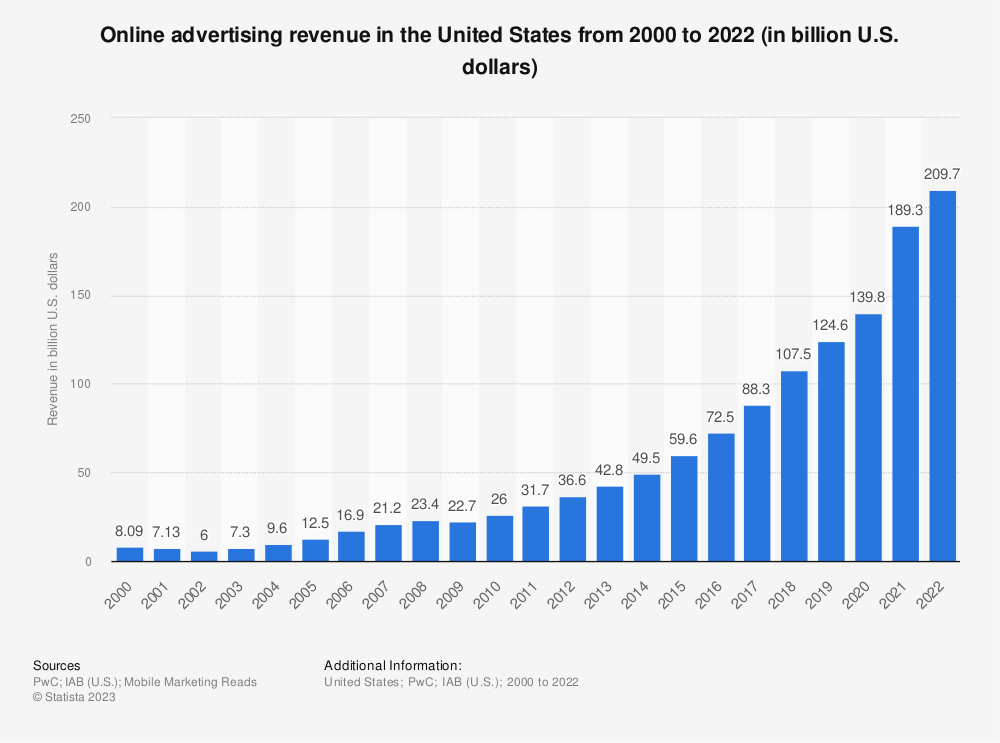
- The United States has the largest internet advertising market in the world. (Statista)
- The American pay-per-performance value makes up 24.4% of global advertising efforts. (Finances Online)
- 54% of media spending in the US went toward the Internet. (Finances Online)
- The global programmatic display internet advertising size is expected to reach $2,772.7 billion by 2028. (Global Newswire)
- Asia has 38% of the ad trade value in purchasing power parity. (Finances Online)
- Ads can increase brand awareness by 80%. (WebFX)
- $8 out of $10 in advertising budgets are used toward online advertising. (Statista)
- Internet advertising spending is expected to reach 200 billion USD by 2025. (Statista)
- The retail industry invests the most money in digital advertising. (Statista)
- Pharma and healthcare account for 11% of the nation’s online advertising spending. (Statista)
- AR advertising is expected to be worth $198 billion by 2025. (User Guiding)
Learn More:
* 20 Benefits of Advertising via Online Channels
* AI for Marketing: Best Examples of How AI Helps in Advertising
* Demystifying Google Paid Ads: A Beginner’s Guide for Online Advertising
PPC Statistics
- Search Internet advertising is the most profitable digital advertising format. (Statista)
- Search advertising will continue dominating the paid media space from 2019 to 2027. (Allied Market Research)
- Google generates the most digital advertising revenue among digital publishers in the US. (Statista)
- Search advertising generates the majority of both mobile and desktop revenue. (Influencer Marketing Hub)
- 56% of Google’s revenue comes from search ads. (Oberlo)
- Advertisers in the United States spend more than $46 million on search ads. (WebFX)
- Augmented reality is becoming more common in PPC advertising. (User Guiding)
- Paid search ads can increase brand awareness by 80%. (LitCommerce)
- CPA on search is $48.96, and $75.51 for display ads. (PPC Expo)
- The top three PPC ads receive 46% of page clicks. (WebFX)
- 52% of PPC ad clicks come from users on mobile phones. (WebFX)
- Consumers who click on PPC ads are 50% more likely to purchase an item than consumers who click on organic results. (WebFX)
- 60% of mobile users will call a business on a Google search. (Think With Google)
- Users are four times as likely to click on a Google paid search ad than on any other search engine. (WebFX)
- Businesses can make $2 for every $1 spent on PPC ads. (WebFX)
- The average CPC for Google search ads is $1-$2. (WordStream)
- On average, PPC campaigns cost $9,000 to $10,00 per month. (WebFX)
- More than half of search engine users can’t distinguish between PPC ads and organic search results. (WebFX)
- The average Google CPC is $1.16. (WebFX)
- Paid search accounts for 39% of the average ad campaign’s budget. (WebFX)
Learn More:
* Tips + Tools to Create Successful International PPC Ads
* Multi-Channel PPC Advertising Case Study: Boosting Your ROI
* Enterprise Paid Ads: A Guide to Landing High-Value Clients with PPC
E-Commerce Advertising Statistics
- The global e-commerce market is expected to be worth $6.3 trillion by 2023. (Forbes)
- This figure will increase to over $8.1 trillion in 2023. (Forbes)
- The US e-commerce market will generate $1.1 trillion in sales in 2023. (Forbes)
- 20.8% of retail purchases will be online in 2023. (Forbes)
- Mobile commerce will make up 6% of this figure. (Forbes)
- This figure will increase to 24% by 2026. (Forbes)
- Mobile commerce sales will amount to $710 billion by 2025. (Forbes)
- 87.12 million online shoppers spent $91.2 billion during Black Friday in 2022. (Forbes)
- 77 million online shoppers spent $11.3 billion during Cyber Monday in 2022. (Forbes)
- The US will see 16.4% of retail purchases occurring online in 2023. (Forbes)
- 91% of people make a purchase using their smartphones. (Forbes)
- Amazon generates 37.8% of e-commerce sales and has the highest market share of all e-commerce companies. Forbes)
- 79% of consumers shop online at least once a month. (Forbes)
- The most-visited e-commerce websites are eBay, Walmart, and AliExpress. (Forbes)
- E-commerce sales are expected to grow by 10.4% in 2023. (Forbes)
- Most e-commerce sellers use search engines, such as Google Shopping, Bing, and Yahoo, for digital advertising. (User Guiding)
- Amazon’s digital advertising revenue will increase over the next few years. (Statista)
- US e-commerce companies are expected to spend $34 billion in advertising. (Statista)
![]()
- Online stores with more than 200,000 SKUs use internet advertising on 50% more channels than stores between 50,000 and 200,000 SKUs. (User Guiding)
- Online stores with 1-5,000 SKUs advertise on just over two advertising platforms. (User Guiding)
- 70% of online sellers advertising on only one platform target one country. (User Guiding)
- 99.01% of advertised products are marked as “new.” (User Guiding)
- 18% of advertised electronics are refurbished. (User Guiding)
- 34.68% of advertised video game consoles are second-hand. (User Guiding)
- Only 36.4% of advertisers use “refurbished” or “new” in the product title. (User Guiding)
- 80% of consumers are more likely to buy from a company that offers a personalized experience. (User Guiding)
- 39% of B2B buyers experience a poor level of personalization. (User Guiding)
- Mobile wallets accounted for 50% of worldwide e-commerce transactions. (User Guiding)
- 57% of consumers shop internationally. (Forbes)
- The online cart abandonment rate on mobile is 84% and 72% on desktop. (Forbes)
- 48% of consumers abandon their shopping cart due to extra costs, such as taxes and shipping fees. (Forbes)
- AR advertising is becoming popular in the e-commerce realm, specifically in the beauty, fashion, and home furnishing industries. (User Guiding)
- 54% of consumers say AR encouraged them to make a purchase. (User Guidance)
- Consumers engage with 3D product images 50% more than static images. (User Guiding)
- 16.66% of advertised products can’t be purchased because they’re out of stock. (User Guiding)
Video Advertising Statistics
- 80% of internet content was video in 2022. (Influencer Marketing Hub)
- 91% of internet users want more video content. (Live Your Message)
- 45% of consumers want more video content. (Live Your Message)
- Internet users spent 250% more time watching videos over the past five years. (Live Your Message)
- 54% of internet users would rather watch a video to learn about a product than read a text description. (Live Your Message)
- Videos that are two minutes or shorter get the most engagement. (Live Your Message)
- 66% of B2C and 71% of B2B marketers use video in their campaigns. (Live Your Message)
- Companies are increasing their video budgets by 25% YOY. (Live Your Message)
- 92% of marketers say they make a good ROI on video marketing. (Live Your Message)
- 68% of marketers say video marketing gives them a better ROI than Google Ads. (Live Your Message)
- 78% of marketers say they saw increased sales when using video. (Live Your Message)
- Mobile video internet advertising is worth more than $81 billion. (Statista)
- 87% of business-related videos are watched on a desktop. (Live Your Message)
- Connected TV (CTV) ad spend increased to $50 billion in 2022. (Influencer Marketing Hub)
- Video advertisements can increase conversions by 86%. (WebFX)
- Brand association increases by 139% after watching a video. (WebFX)
- 93% of marketers say they received new business after posting video content on social media platforms. (Live Your Message)
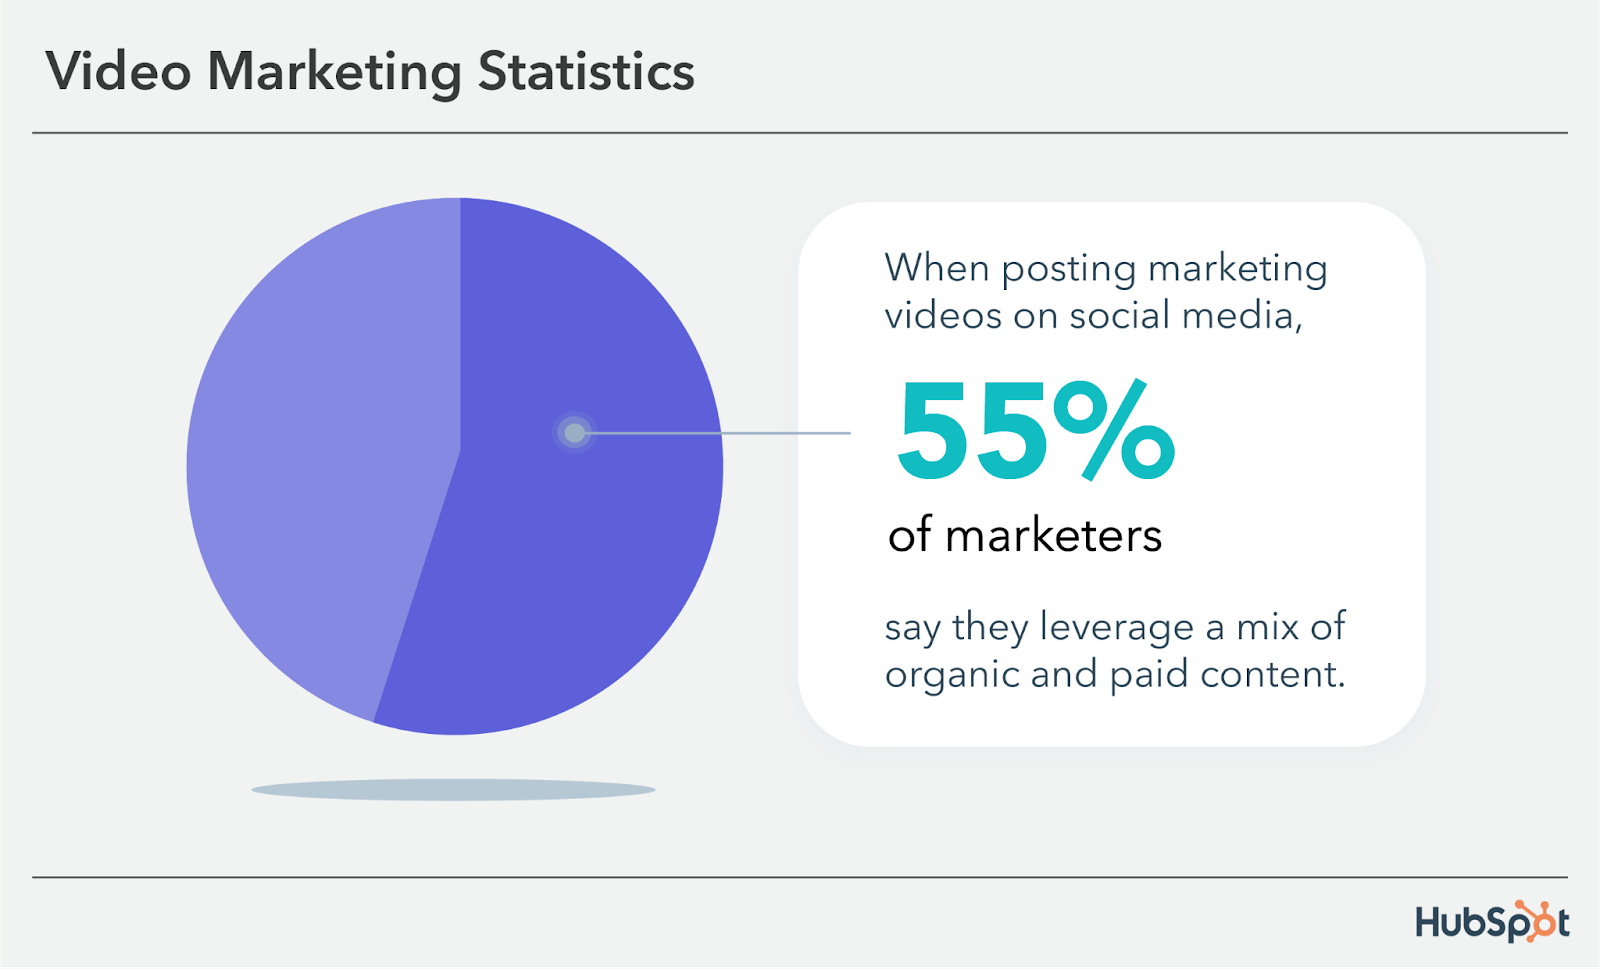
- 55% of marketers say they use organic and paid content when posting social media videos. (HubSpot)
- 90% of marketers share their content on YouTube. (Live Your Message)
- Promotional videos, brand storytelling, and product demos are the most popular video types shared by businesses. (Live Your Message)
- 50% of video viewers prefer captions on the video and to watch with the sound off. (Live Your Message)
- Watch time for shopping-related YouTube videos increased 5x in the US. (Live Your Message)
- 80% of shoppers watch a YouTube video before making their planned purchase. (WebFX)
- Over 40% of shoppers worldwide say they purchased products they discovered on YouTube. (WebFX)
- 90% of shoppers say watching a video helps them make a purchasing decision. (WebFX)
Learn More:
* Spotify Ads 101: How to Run Successful Audio and Video Ads
* 8 Benefits of Video Ads: Why You Need Them in Your Advertising Strategy
Audio Advertising Statistics
- Digital audio is one of the fastest-growing channels, experiencing a yearly growth rate of 57.9%. (Influencer Marketing Hub)
- There will be 1.52 billion audio listeners by 2027. (Statista)
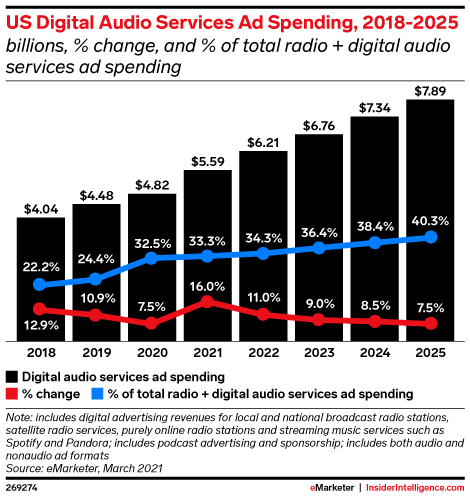
- Digital advertising audio spending is expected to reach 6.76 billion USD by 2023. (Insider Intelligence)
- Audio digital advertising spending is experiencing a 2023-2027 CAGR of 6.04%. (Statista)
- The US has the highest number of podcast listeners worldwide. (Statista)
- 76 million people listen to podcasts regularly. (Statista)
- Audio ad spending in the US amounts to 5,870 million USD, making it the largest global market investing in audio advertising. (Statista)
- The following countries that invest most in audio spending are China, India, Japan, and the UK. (Statista)
- The average audio ad spending per user is 7.59 USD. (Statista)
- 77% of audio ad spending goes toward mobile platforms. (Statista)
- Mobile ad spending growth is expected to be 0.2% on audio platforms. (Statista)
- 7 in 10 Americans don’t mind a couple of extra minutes’ worth of paid ads added to a podcast. (Statista)
- Most audio ads go toward music streaming than podcasts. (Statista)
Related Content: Audio SEO: The Complete Guide to Ranking Your Podcast Successfully
Mobile Advertising Statistics
- Mobile digital advertising spend amounted to nearly $50 billion in 2022. (Influencer Marketing Hub)
- Mobile advertising spending will reach nearly $500 billion by 2024. (Influencer Marketing Hub)
- Ever since 2018, mobile advertising has been favored over desktop campaigns. (Statista)
- 61.9% of paid clicks come from mobile devices. (The Social Shepherd)
- Companies can see a 46% increase in brand awareness with mobile advertising. (Finances Online)
- Mobile advertising accounts for 64% of digital ad spending in the US. (Statista)
- Mobile ad spending is expected to exceed $339 million by 2023. (WebFX)
- Search and video advertising are the most invested in paid ad campaigns. (Statista)
- Mobile ads come with a lower ad blocker penetration rate. (Statista)
- 78% of local mobile searches result in an in-store purchase. (WebFX)
- 61% of consumers say they prefer purchasing from mobile-friendly websites. (WebFX)
Learn More: 11 Brands That Are Doing Mobile Advertising Right
Influencer Advertising Statistics
- Influencer marketing is expected to be worth $21.1 billion in 2023. (Influencer Marketing Hub)
- 81% of marketers say influencer advertising works (WebFX)
- 92% of consumers trust recommendations from people over brands. (WebFX)
- 70% of teens trust influencers more than traditional celebrities. (Forbes)
- 49% of shoppers admitted an influencer inspired a purchase decision. (Forbes)
- 62.9% of brands say they will use AI or machine learning in their influencer campaigns. (Influencer Marketing Hub)
- 64% of brands say they will use AI/ML to identify the most effective influencers for their campaign. (Influencer Marketing Hub)
- 42% of brands pay influencers, as opposed to only giving them a free product. (Influencer Marketing Hub)
- More than half of influencer payments are generated as a percentage of a sale. (Influencer Marketing Hub)
- TikTok accounts for 56% of influencer marketing, with Instagram at 51%. Facebook (42%) and YouTube (38%) are the follow-ups. (Influencer Marketing Hub)
- TikTok delivers the best ROI for influencer campaigns using short-form videos. (Influencer Marketing Hub)
- 60% of brands work with more than 10 influencers. (Influencer Marketing Hub)
- 39% of brands prefer working with nano-influencers, and 30% prefer working with micro-influencers. This exceeds those that prefer working with macro-influencers (19%) and celebrities (12%). (Influencer Marketing Hub)
- In Influencer Marketing Hub’s survey, fashion/beauty influencer marketing and advertising is the most popular vertical, making up 25% of their respondents. The next popular categories are gaming, travel/lifestyle, sports, family/parenting/home, and health/fitness. (Influencer Marketing Hub)
- Influencer advertising and marketing are becoming more global. In that same survey, 31% of respondents were from Africa, and 28% described their location as “Other.” Only 16% of respondents came from the US, 14% from Asia, and 8% from Europe. South America had the lowest number of respondents, with 4%. (Influencer Marketing Hub)
- In that same survey, 38% of responding companies had fewer than ten employees, making influencer marketing more popular with startups. (Influencer Marketing Hub)
- 51% of respondents in the survey were in the e-commerce industry. (Influencer Marketing Hub)
Learn More: Influencer Marketing Strategy: The Ultimate Guide to Growing Your Business with Brand Partnerships
Display Advertising Statistics
- Display advertising is expected to achieve a 7.91% annual growth by 2027. (Write Cream)
- Banner mobile advertising spending will total $167.8 billion. (Write Cream)
- Google display ads can appear on over 2 million websites and 650,000 apps. (Acquisio)
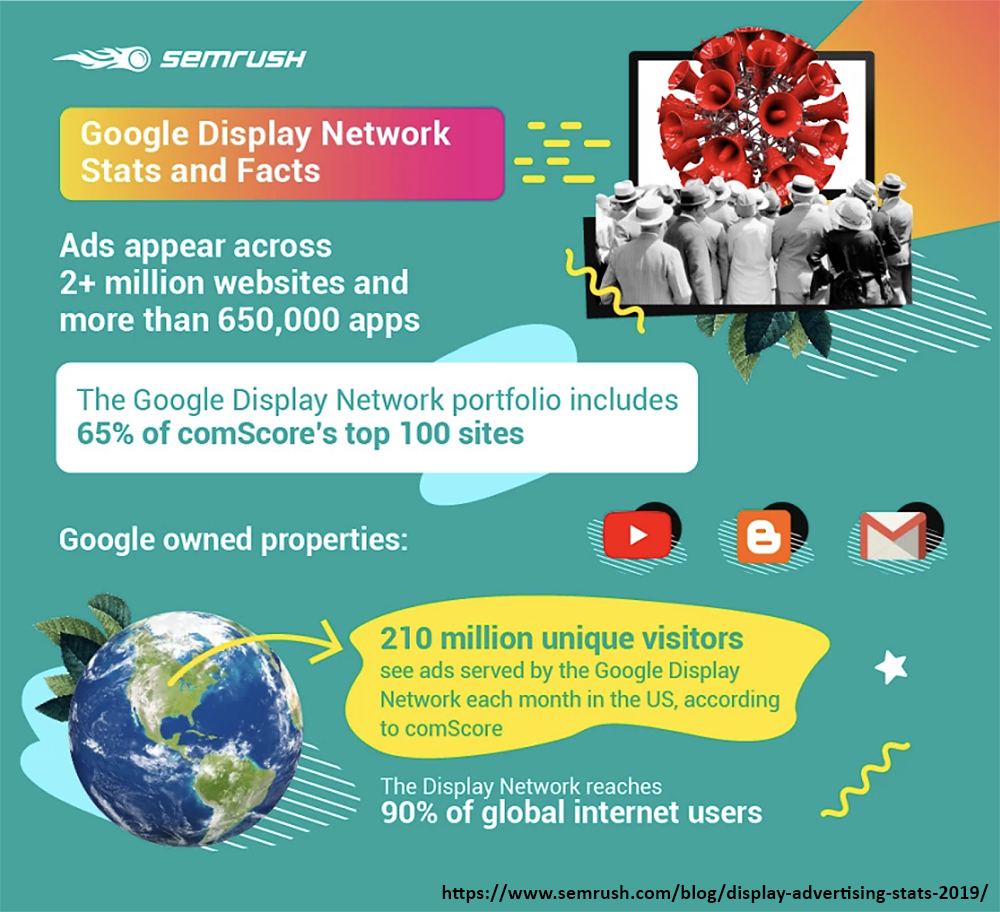
- Google’s display portfolio includes 65% of comScore’s top 100 sites. (Acquisio)
- 210 million unique visitors see ads from the Google Display Network every month. (Acquisio)
- Google’s Display Network reaches 90% of global web users. (Acquisio)
- The average CPC for display ads is $0.63. (Write Cream)
- The average CTR for a display ad is 0.35%. (Write Cream)
- Image ads are the most common types of ad content that boost audience engagement. (WebFX)
- Programmatic display digital advertising has a digital ad spend of over $50 million. (WebFX)
- The top display optimization tactics are audience targeting and ad placement. (WebFX)
Social Media Advertising Statistics
- 7 in 10 Americans use social media. (WebFX)
- 86% of women use social media for purchasing advice. (Forbes)
- Global social commerce sales are increasing in B2B and B2C markets. (User Guiding)
- 87% of marketers invest in social media advertising. (WebFX)
- Social media ad spend increased to $57.7 billion. (Influencer Marketing Hub)
- Facebook ad spend is more than $31 million. (Finances Online)
- 94% of Facebook’s advertising revenue comes from mobile users. (WebFX)
- 74% of consumers use social media when making a purchasing decision. (WebFX)
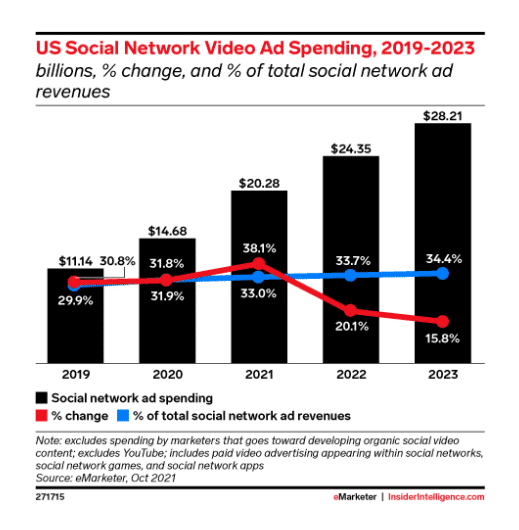
- U.S. companies will spend $28.21 billion on social media video ad spending. (Hootsuite)
- Millennials are more receptive to social media advertising efforts than Gen Z. (Statista)
- Social media commerce is expected to be worth $2.9 trillion by 2026. (Forbes)
- 96.9 million Americans shop online via social media channels. (Forbes)
- It’s expected this figure will continue increasing by 18%. (Forbes)
- 55% of Gen Zers have made a purchase on social media. (Forbes)
- Most social media shoppers are in China. Nearly 50% of people in China made a purchase from social networks. (Forbes)
- Facebook is the most popular platform for e-commerce transactions. (Forbes)
- Instagram and TikTok let users make a purchase directly on the app. (User Guiding)
- 40% of consumers made a purchase because of social influence. (Forbes)
Learn More:
* Top 8 Benefits of Social Media Advertising
* 15 B2B Social Media Trends You Can’t Ignore
* 30 Social Media Advertising Statistics to Improve Your Strategy
In-App Advertising Statistics
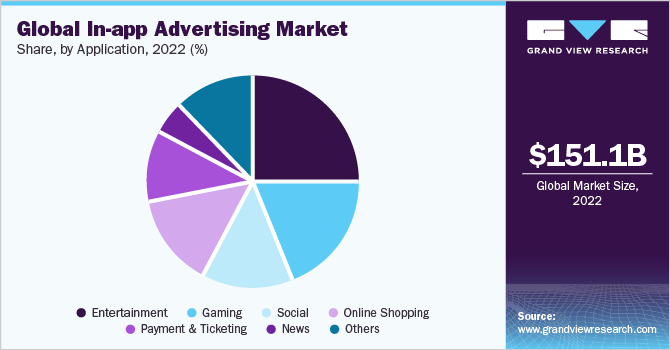
- The in-app advertising market size is $151.1 billion (Grand View Research)
- In-app advertising is more popular among entertainment and gaming apps. (Grand View Research)
- In-app ad revenue is expected to rise by 19.1% for gaming apps and 6.2% for non-gaming apps. (WebFX)
- The CTR of in-app ads is 0.56%. (Publift)
- In-app ads increase customer retention 4x more than other ads. (Publift)
- Mobile apps convert 3x more viewers. (Publift)
Learn More: 25 In-App Advertising Statistics to Supercharge Your Strategy
Privacy and Trust Advertising Statistics
- 4 in 10 Americans are annoyed by digital advertising. (Statista)
- 54% of online users don’t trust banner internet advertising and don’t click the ads. (Marketing Insider Group)
- 70% of Americans are annoyed by pop-up internet advertising. (Cybba Digital Services)
- 99% of Gen Zers block paid ads. (Digital Doughnut)
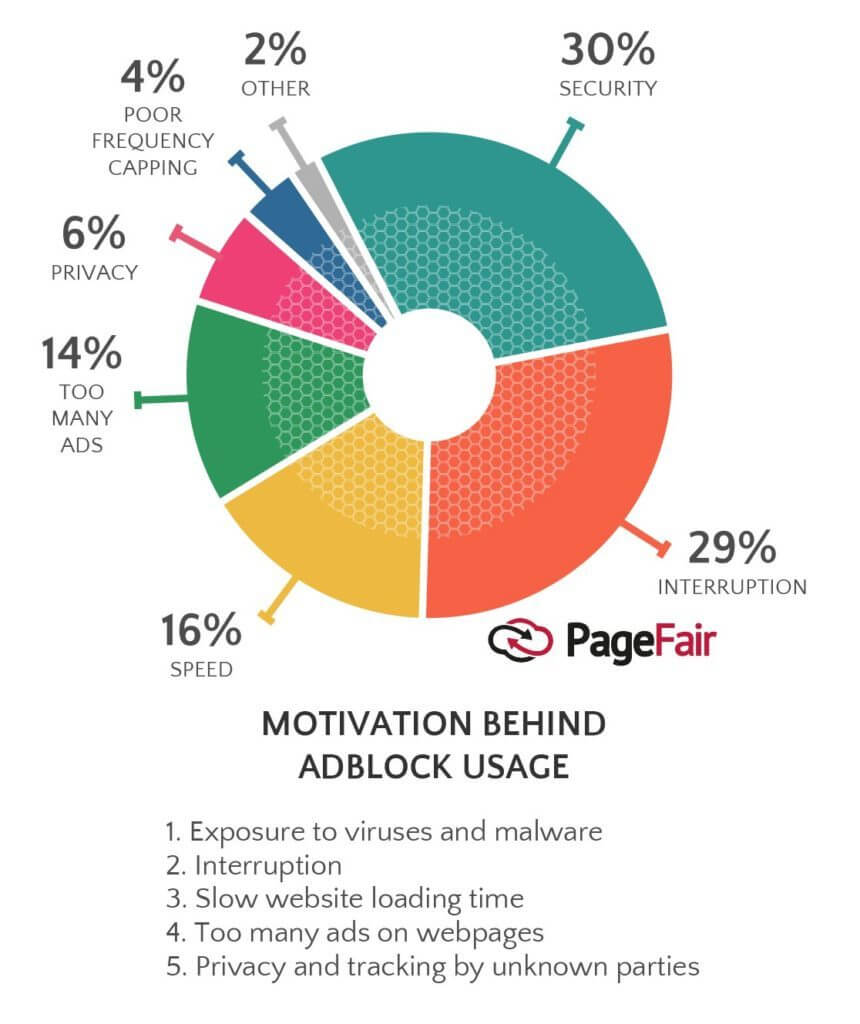
- 30% of users block ads for security reasons. (Blue Corona)
- 586 million people use internet browsers that block ads. (Influencer Marketing Hub)
- Brands and publishers could lose millions of dollars in digital ad spend due to ad blocking. (Influencer Marketing Hub)
- Opt-in rates for acceptable ads are over 95%. (Influencer Marketing Hub)
- 47% of adults avoid in-app ads. (Finances Online)
- People are more likely to click ads on the platforms they trust. (Insider Intelligence)
- LinkedIn is the most trusted social media platform, while fewer people trust Facebook. (Insider Intelligence)
- 64% of consumers are willing to share their email addresses, but only 16% are willing to share their home addresses. (Insider Intelligence)
- 36% of marketers believe customer purchase history is the best first-party data source. Insider Intelligence)
- 58% of publishers don’t use data clean rooms due to budget. (Insider Intelligence)
Learn More:
* The Email Marketer’s 4-Step Guide to GDPR Compliance
* How Poor Website Security Negatively Impacts SEO Rankings
* Google Privacy Sandbox: What Does It Mean for the Future of Targeted Ads?
Use These Online Advertising Statistics to Plan Your Campaign
In a world where online advertising and digital marketing play a vital role in any business’s success, large or small, the ability to leverage data and make well-planned and informed decisions can be the difference between stagnation and exponential growth. The latter, obviously, is the preferred path!
The advertising statistics shared in this article illustrate that more people are browsing on their mobile phones, shopping online, consuming video content, and being selective over which platforms they trust with their data than ever before.
As technology continues to grow and evolve, this data will become increasingly abundant and steadily more critical for success in advertising online.
If you’re ready to level up your business online advertising, Single Grain’s paid ads experts can help. 👇