Common Types of Misleading Statistics in Advertising – And How to Spot Them
More and more each year, misleading statistics manage to pop up and cloud people’s understanding of the real state of digital advertising. Companies and advertisers have realized that statistics can be manipulated to present their products in the best light possible and, as a result, consumers are often presented with false advertising.
One big reason misleading statistics are so common in marketing campaigns is that many marketers don’t fully recognize the subtle tactics used to frame numbers in persuasive—but sometimes deceptive—ways.
In this post, we’ll look at the most common types of misleading statistics, the industries that most often use this bad practice, and give you an idea about how to spot them.2
TABLE OF CONTENTS:
- Key Highlights
- The Power and Pitfalls of Statistics in Advertising
- Industries Most Affected by Misleading Statistics
- Techniques Used to Manipulate Data in Advertising
- 7 Examples of Misleading Statistics in Advertising
- Sephora and Clean Beauty Ad
- Teami and Unsubstantiated Health Benefits
- Bang Energy Super Creatine Ad
- Hey Dude Shoes Suppressed Negative Customer Reviews
- Activia Yogurt Overstated Its Health Benefits
- Low-Level Light Therapy Device Claims It Treats Chronic Pain
- Sobriety Supplement Relied on Paid Endorsements and Fake Reviews
- Combating False Advertising Statistics
- Last Word on Misleading Statistics in Advertising
- Related Video
Key Highlights
-
Common tactics in misleading advertising statistics, including cherry-picking data and using vague metrics to skew perceptions.
-
Examples from well-known brands that show how statistics can be manipulated to create a favorable but misleading narrative.
-
The impact on consumer trust and how misleading statistics can damage brand credibility in the long run.
-
Insight into red flags for spotting misleading stats, such as small sample sizes, ambiguous claims, and out-of-context data.
-
Discussion on ethical advertising practices and why transparency in data presentation is essential for sustainable brand loyalty.
-
A helpful read for marketers, consumers, and businesses aiming to understand truth in advertising and how to maintain integrity in promotional strategies.
The Power and Pitfalls of Statistics in Advertising
Consumers look for facts when shopping for products and services, and the internet makes it easy for the normal person to gather data and learn insights into various topics. At the same time, the internet is a hotbed for misinformation, false advertising and misleading facts. Unfortunately, there’s still a gray cloud of knowledge on the techniques used to gather that data and whether the company behind the ad is as trustworthy as one thinks. That’s why all consumers should understand why misleading advertisements have a serious impact.
How Statistics Influence Consumers
Before purchasing a product or service, consumers want to view facts to make sure their purchase will benefit their lives and solve their pain points. That’s why many brands mention statistics in their marketing and advertising campaigns. Statistics offer an easy way for leads to consume and compare data; users can process percentages and graphs faster than narratives, and they will have an easier time evaluating the effectiveness of the product or service. Let’s take the food and beverage industry as an example. According to the National Library of Medicine, product information and labeling are important factors consumers use to decide whether or not to try a food or beverage. Companies not only use nutritional facts to convey this data, but also state the health benefits of the food or beverage. This data is essential for consumers to maintain a healthy diet and know how the food may impact their health.
Jumping to Conclusions too Early
While mentioning statistics and claims may be effective in advertising, consumers experience a major problem: jumping to conclusions early. Before going into product research, people may already know what they want or are looking for. They will still feel more comfortable conducting research before purchasing anything, but most consumers will approach this process with a goal. If a user finds an anti-aging skincare moisturizer that touts “90% of users experienced fewer wrinkles,” this statistic will be enough for consumers to purchase the product. They won’t realize or even care that it’s a false advertising claim. When the numbers are that high (in a positive light), people won’t ask themselves more questions. For instance, the brand could have conducted the survey on college students and not those with aging symptoms, creating biases in the research.

This leads us to our next point.
Biases in the Claims – and the Consumer
Companies are always going to be biased for their own product or service. But it doesn’t help that consumers have their own biases when finding products and services to use. If people want something to be true, they will find every source to prove their point. The keto diet is the perfect example. During the 2010s, this diet was all the rage. This diet encouraged users to eat more fat and protein and fewer carbs. But the real reason why people followed this diet was to consume more of their favorite fatty meats, notably bacon. When you go to Google and search “keto diet and bacon,” you’ll find numerous websites (mainly meat companies and keto websites) encouraging users to include bacon in their meals:
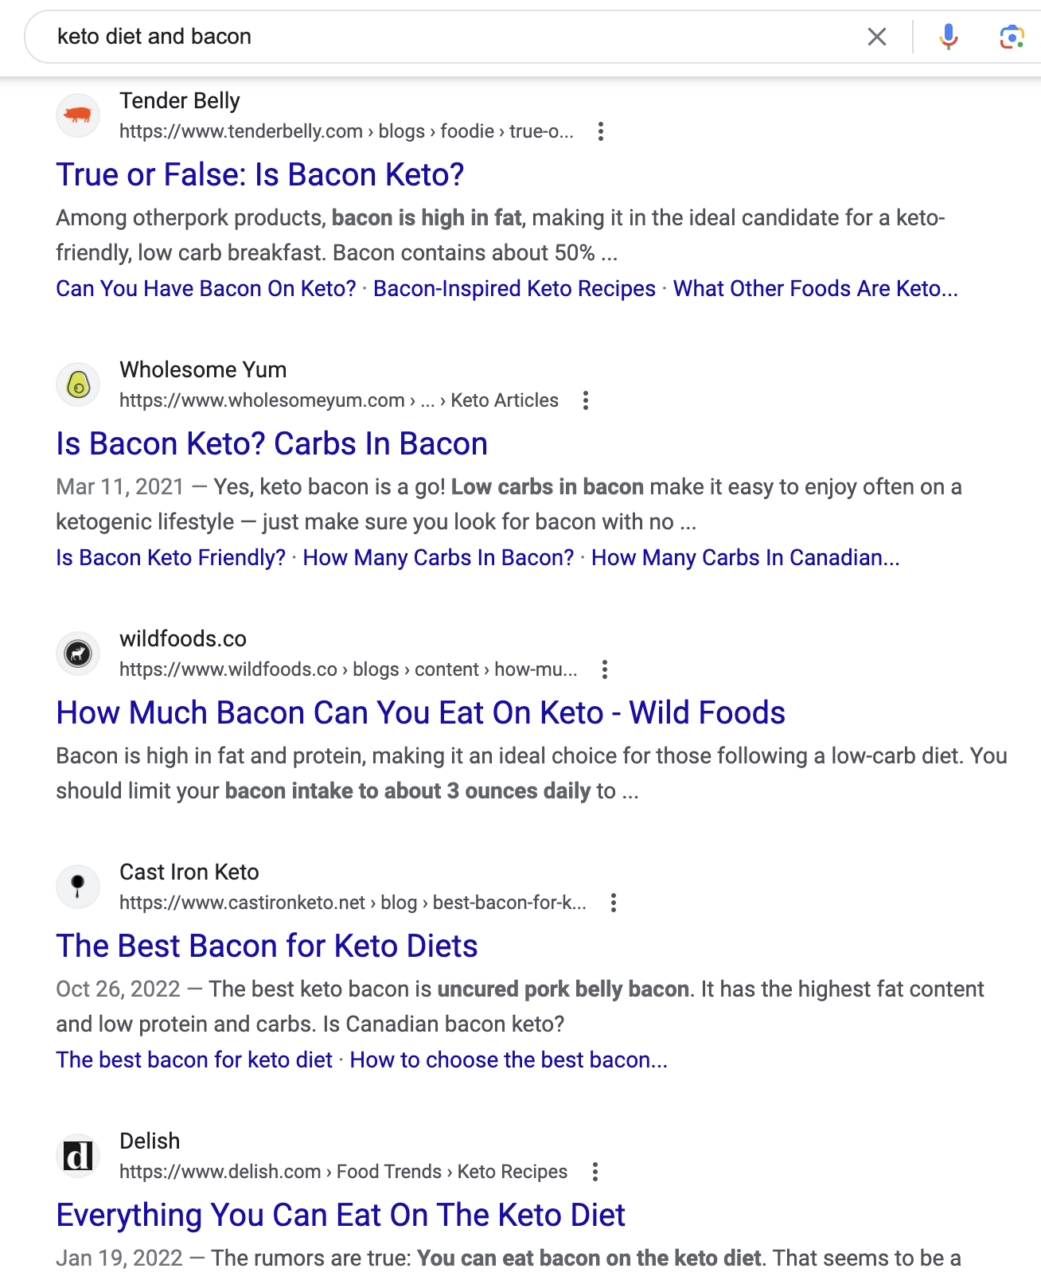
At the same time, if you search “is bacon healthy,” you’ll find sources that state bacon is loaded with cholesterol and sodium, which still increases your risk of heart disease. In this example, we see the meat and keto food companies using false advertising to encourage users to switch to keto to eat more bacon while losing weight. But the statistics are limited; they not only ignore the additional health issues of eating bacon but fail to mention how to shop for bacon in the healthiest way (such as checking sodium levels).
Thin Line Between Persuasive and Misleading
Approaching product research with biases and jumping to conclusions presents a major issue with statistics in advertising: the veil between persuasiveness and misleading data. Good advertising is persuasive. This ensures that leads connect with the ads and are more compelled to buy a product. When advertisers create campaigns, they focus on one or more of these qualities:
-
Intent
-
Emotions
-
Appearance
When powering one or more of these factors in advertising, your prospects will find a use for your product or service and add to the sentimental value of your ad. But on the other hand, advertisers can use these factors to capture vulnerabilities, using misleading statistics to entice action and even spread misinformation. They may also do this with claims and false advertisements. The scariest part is that these claims may not always be considered fraudulent. Claims such as “X skincare product can reduce wrinkles” and “bacon is part of a keto diet” are true, but the companies fail to address the high intent targeting and selection biases they use to profit from these advertising claims.
Truthfulness in Advertising Is Crucial for Consumer Trust
Trust and credibility are two of the most important factors businesses need to attract and retain customers. That said, it takes time and effort to build long-term relationships with consumers. Some businesses may resort to statistics that hone in on biases and impulsive buying, ensuring that they get a quick sale. Even though consumers can access data quickly online, a negative brand reputation does serious damage in our digital world. This is why creating honest online ads is one of the key ways to build success. Plus, governing bodies have many advertising rules, and adhering to them will prevent you from fines and lawsuits.
How Brands Can Use Statistics Ethically
While some brands have used misleading statistics to increase profits (as we will discuss later), companies should also back up the effectiveness of their product with data. The key is to do so ethically. First, give your consumers enough insight to look beyond the numbers. In other words, offer transparency into how you collected your data, the general demographics of any research participants, and how you reached your conclusions. Staying open about the context is also important. Don’t make your study about selling products; instead, let the data speak for itself. Avoid any biases in your research – be open if there are any flaws or drawbacks you find. If you offer any data visualizations, make sure they’re easy to interpret, have enough data so your consumers can follow the chart or graph, and always provide sources.
Industries Most Affected by Misleading Statistics
While all industries are affected by misleading statistics, some are more susceptible than others. These include:
The Tobacco Industry’s Manipulation of Data
The tobacco industry has a long history of manipulating data and creating misleading statistics to downplay the risks associated with smoking. For instance, in the 1950s, the industry commissioned a research committee that created industry-sponsored research that downplayed the link between smoking and cancer:
“This tactic offered several essential advantages. The call for new research implied that existing studies were inadequate or flawed. It made clear that there was more to know, making the industry seem a committed participant in the scientific enterprise rather than a self-interested critic… [The] research program would be controlled by the industry yet promoted as independent.”
This was a classic case of cherry-picked data to support its claims. This “research” was widely criticized by the scientific community, but it succeeded in creating doubt in the minds of consumers about the link between smoking and cancer. This doubt allowed the tobacco industry to continue selling their products for many years, even as evidence mounted about the dangers of smoking:
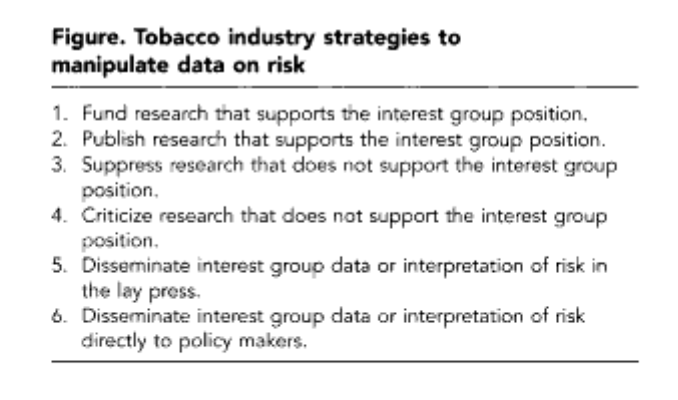
In addition to commissioning studies, the tobacco industry has also used statistics that show that only a small percentage of smokers develop lung cancer, without mentioning that smoking increases the risk of many other health problems, such as heart disease and stroke. By focusing on a single statistic, the tobacco industry created the impression that smoking was not as dangerous as it really is.
Weight Loss Products and Dietary Supplements
Advertisers may use small sample sizes or manipulate graphs to make it appear that their weight-loss product is more effective than it really is. An advertiser may conduct a study with biased “researchers” and a small sample size. They may find that their product resulted in a 50% weight loss, without mentioning that the study only included a handful of people. Or, as in the case of Sensa’s weight loss powder, they may simply use language like “clinically proven” without linking to any studies:
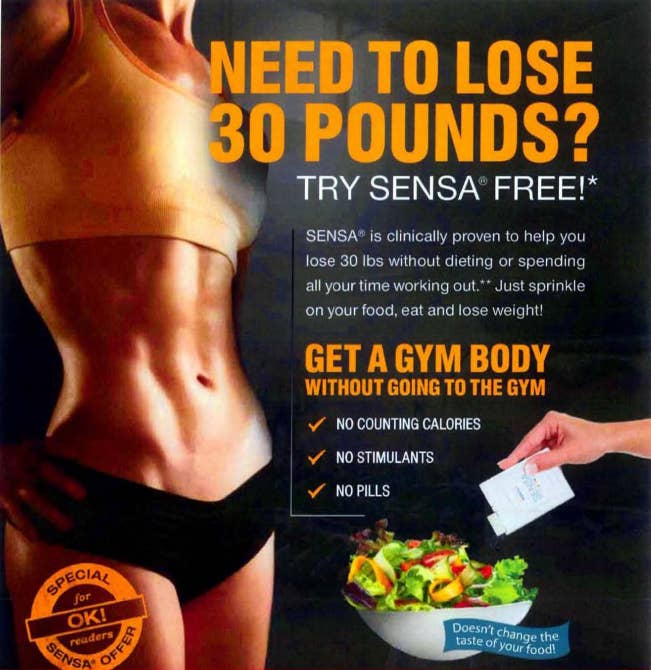
Sensa Products, the CEO Adam Goldenberg and their paid endorser Dr. Alan Hirsch were ordered to pay $26.5 million as part of a $46.5 million judgment. This type of misleading statistic can be particularly dangerous, as it can lead consumers to believe that a product is safe and effective when it is not:
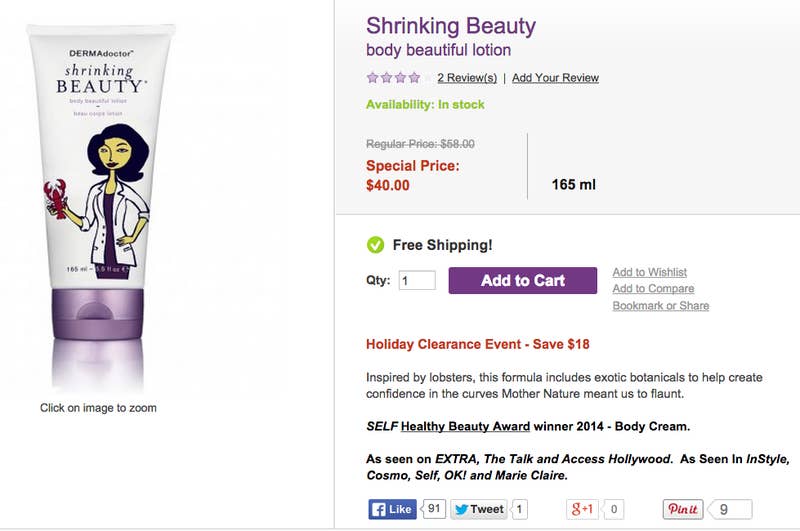
In addition to manipulating statistics, weight loss product advertisers also often use before-and-after photos in their advertising. These photos can be manipulated in various ways, such as using different lighting or camera angles, to make it appear that the product is more effective than it really is. By the way, it’s worth looking at this list of incredible weight-loss claims, including one ad for “lobster-inspired slimming cream…that simulates a lobster’s ability to shrink its body” (!?):
Misleading Food and Beverage Health Claims
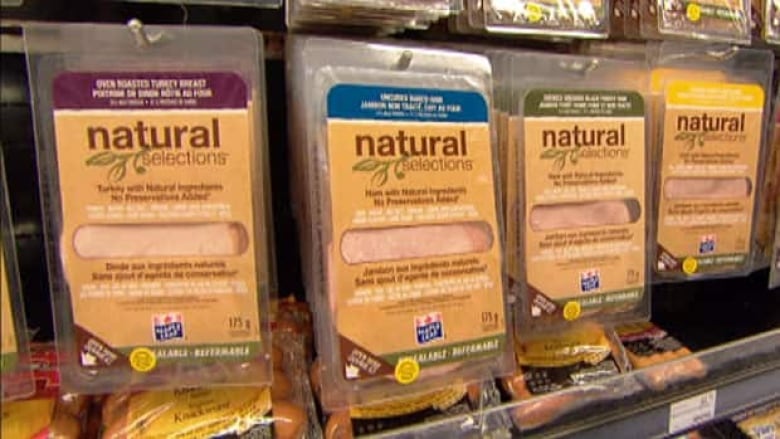
Companies in the food and beverage industry often use online advertising to claim their products are healthy or low in calories without providing accurate data to support these claims. A company may claim that its product is “low-fat” or “low-calorie” without mentioning that it is also high in sugar or sodium. Maple Leaf Foods’ deli meat states on the package “no added preservatives” even though it actually contains nitrite, which is a preservative that is linked to cancer. Although the company denied that its labels were written in a misleading way, it later amended its packaging to say that its deli meat does contain nitrite after a CBC Marketplace investigation:
In addition to misleading claims about the nutritional content of their products, food and beverage companies also often use statistics in their online and print ads to create the impression that their products are more popular or healthier than they really are. For instance, a brand may claim that its product is the “number one choice” of consumers without mentioning that this claim is based on a small survey of a select group of people. Other industries include:
-
Beauty industry: Studies may be conducted on participants with a specific skin type, distorting the study results. Small or skewed samples may be used and will result in an inaccurate hypothesis.
-
Mainstream media: Modern mainstream media outlets exercise biases when reporting, such as favoring a certain political party over another. This causes the mainstream to report on false information or exaggerating facts. Many media outlets also favor the status quo and may choose to report on certain stories over others.
-
Alternative health industry: Some products under the “alternative” and “complementary” treatment categories (such as supplements, herbs and essential oils) often lack the research that conventional medication is required to undergo. That means consumers may lack vital knowledge of these products, such as side effects, allergy information and drug interactions.
Note: This doesn’t necessarily mean that supplements are backed by false claims. Unlike drugs, which are designed to treat or cure diseases, dietary supplements are intended to provide nutrients that might be missing from a person’s diet. As such, they’re regulated differently. The FDA doesn’t review dietary supplements for safety and effectiveness before they are marketed, but it does monitor their safety once they’re on the market.
Related Content: 187 Online Advertising Statistics: Privacy, In-App, PPC, Social and More
Techniques Used to Manipulate Data in Advertising
There are a range of techniques used to manipulate data in advertising, and understanding these techniques is essential for consumers to make informed decisions about the products and services they choose to buy. By being aware of these techniques, consumers can avoid being misled by false advertising statistics. Here are the most common types of false advertising – and how to spot them.
Cherry Picking Data
This involves data mining and selecting only the data that supports a particular claim while ignoring other responses that contradict it. This can give a skewed view of the information and present an inaccurate representation of the results. For example: A company may only showcase the positive reviews of a product while ignoring the negative reviews. This can lead consumers to believe that the product is universally well-received when, in reality, there may be a significant number of dissatisfied customers. How to spot this technique:
-
Look for the complete picture: Examine whether the presented statistic provides a comprehensive view of the topic or only focuses on a single data point.
-
Seek additional sources: Don’t rely solely on the information provided in the advertisement. Find independent sources, such as reputable research studies or industry reports, to gather a broader perspective.
-
Evaluate sample size and representativeness: Consider whether the sample size used in the statistic is sufficient and representative of the target population.
-
Examine the source of the statistic: Determine the credibility and expertise of the source providing the statistic. If the source has a vested interest or lacks objectivity, scrutinize whether the advertisement provides references to validate the statistic.
-
Seek context and supporting evidence: Look for contextual information that helps you understand the statistic’s relevance and significance. A single statistic without proper context may lead to misinterpretation.
-
Trust your instincts and be skeptical: Develop a healthy skepticism when encountering advertising claims and statistics. If something appears too good to be true or lacks transparency, it is essential to question the validity of the presented data.
Misrepresenting Sample Sizes
Misrepresenting sample sizes is another statistical technique used to manipulate data in advertising. Companies may use small sample sizes, leading to a distorted quantitative analysis. Alternatively, they may use a sample size that does not represent the target population, which can lead to an inaccurate representation of the data. When brands deliver their product to a third-party lab, they often test small-sized samples. In reality, consumers will get more use out of a product than this small amount – specifically, over a period of time. Therefore, testing a small sample size of the product produces misleading results. This can also happen during other forms of testing, such as surveys. A company may only survey 20 users, whose opinions vary radically from the general population.

For example: A company may claim that 90% of their customers are satisfied with their product but only surveyed 10 people. This sample size is not large enough to accurately represent the views of the entire customer base and may not be statistically significant. How to spot this technique:
-
Look for sample size disclosure: Examine whether the advertisement provides information about the sample size used to generate the statistic. Transparent and trustworthy sources typically disclose the sample size to lend credibility to their claims. Lack of sample size information or vague references to “a study” without specific details can raise suspicion.
-
Evaluate sample size in relation to the claim: Consider whether the sample size used in the study or survey is appropriate for the claim being made. Different types of claims may require larger or more representative sample sizes to yield statistically reliable results. Extraordinary claims based on small sample sizes should be examined more critically.
-
Assess representativeness: Determine if the sample used in the study or survey is representative of the target population. A truly representative sample should reflect the demographic, geographic, or other relevant characteristics of the broader population. If the sample is not adequately representative, the results may not be generalizable or applicable to the larger population.
Using Ambiguous or Vague Terms
Another technique used to manipulate data in advertising is the use of ambiguous or vague terms. For example: Advertisers may claim a product is “clinically proven” without specifying which study or trials they refer to. This can lead to confusion for consumers and an inaccurate representation of the product’s efficacy. Similarly, claims such as “all natural” or “organic” are half truths; they may not have a standardized meaning and can be used by companies to make their products seem healthier or more environmentally friendly than they actually are. How to spot this technique:
-
Scrutinize the wording: Pay close attention to the specific terms and phrases used in the statistic or claim. Look for overly general or ambiguous language that lacks clarity and precision. Vague terms may include words like “many,” “most,” “some,” or “a significant number.”
-
Seek concrete numbers or specifics: Look for specific and quantifiable information within the statistics. Misleading ads often rely on vague terms to avoid providing concrete numbers or meaningful details. Concrete numbers or specific percentages provide a clearer picture and allow for better evaluation.
-
Look for contextual information: Evaluate whether the advertisement provides sufficient context and supporting details to explain the statistic. Ambiguous or vague terms may create a sense of importance or superiority without substantiating evidence. A lack of specific examples, references or data sources can indicate a lack of credibility.
-
Consider the absence of benchmarks or comparisons: Misleading ads may use ambiguous terms to avoid making direct comparisons or benchmarks against relevant standards. Look for unclear references to industry standards, competitor performance, or other relevant benchmarks. This lack of comparison can make it challenging to evaluate the significance of the statistic.
-
Analyze the overall message: Assess the broader message conveyed by the advertisement. Misleading ads often use ambiguous terms to create a positive impression without providing substantive evidence. If the statistic is presented in a way that seems more focused on persuasion than providing factual information, it is worth investigating further.
-
Evaluate the source and credibility: Consider the credibility and expertise of the entity or source presenting the statistic. Misleading ads may rely on vague terms to mask a lack of reliable data or to exaggerate claims. Investigate whether the source is reputable and known for accurate information.
-
Cross-reference with reliable sources: Seek additional information or data from independent and trustworthy sources. If the advertisement fails to provide specific information, reliable sources can help verify or refute the claims. Multiple sources with clear and concrete information enhance the credibility of the statistic.
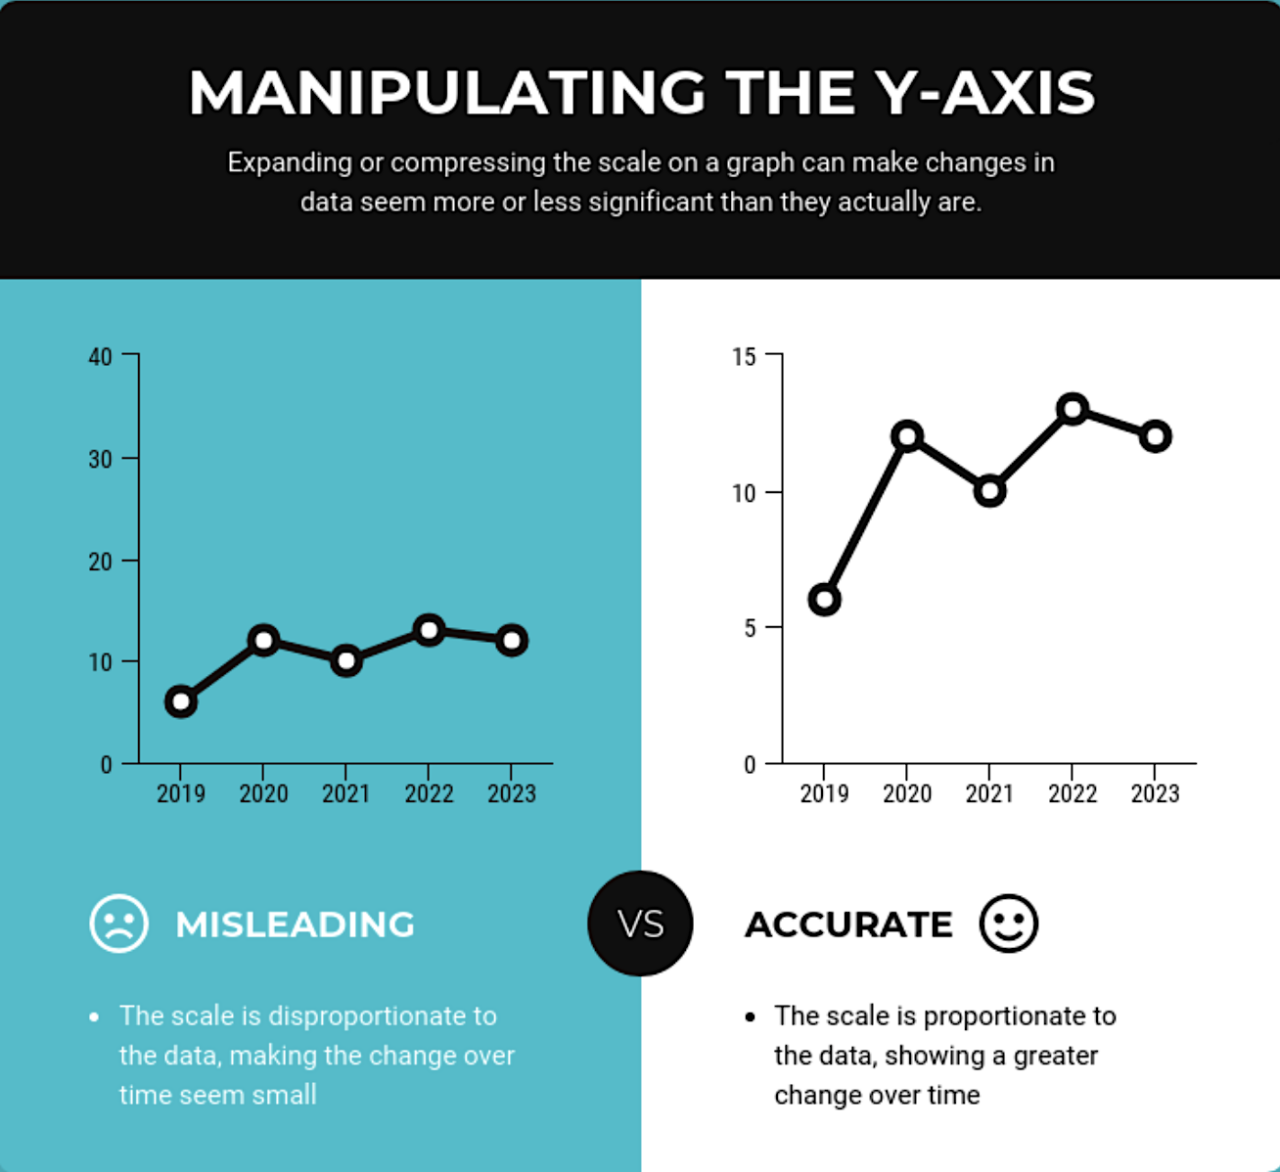
Manipulating Graphs and Visuals
Misleading graphs in advertising can be another technique used to manipulate data in advertising. Advertisers may use a misleading graph or other visual aid that does not accurately represent the data or make changes to the scale of the graph to make the results appear more impressive than they really are. For example: A graph may be designed to exaggerate the difference between two data points, making it seem like there is a larger gap than there actually is. Alternatively, a graph may have a y-axis that starts at a number greater than zero, making a small difference seem much larger than it really is.
How to spot this technique:
-
Examine the axes: Look closely at the graph’s axes or visual representation. Misleading ads may manipulate the scale or range on the axes to exaggerate or minimize the impact of the data. Pay attention to the units of measurement and the intervals between values.
-
Assess the proportions: Evaluate whether the proportions and sizes of the elements in the graph accurately represent the data being presented. Misleading ads might manipulate the size of the bars, pie slices, or other visual elements to distort the perception of relative values or percentages.
-
Check for truncated or omitted data: Look for any signs of truncated or omitted data points on the graph. Misleading ads may selectively remove data points or truncate the axis to make the differences between data points appear more significant or visually impressive.
-
Consider the baseline: Evaluate the choice of baseline or starting point on the graph. Misleading ads might manipulate the baseline to create an illusion of larger or more dramatic changes. By selectively choosing a specific baseline, the advertiser can distort the perception of growth, improvement, or decline.
-
Assess the use of 3D effects: Be cautious of excessive or unnecessary 3D effects in graphs or visuals. While 3D elements can make a graph visually appealing, they can also introduce distortions that misrepresent the data. Pay attention to whether the 3D effects enhance understanding or simply serve as a visual trick.
-
Consider the overall narrative: Evaluate the narrative or message conveyed by the advertisement. Misleading ads may use manipulated graphs or visuals to support a predetermined storyline or to emphasize a specific point without accurately reflecting the underlying data. Assess whether the visuals align with the overall credibility and transparency of the ad.
Biased Questions
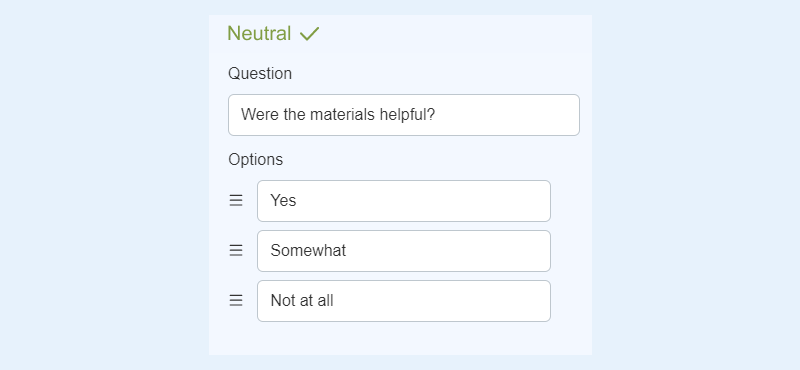
To extract data from participants, analysts will often ask questions to gauge their opinions and insights. However, these questions could be biased, often called “loaded questions.” For example: Let’s say a group is testing a marketing tool. At the end of the trial period, the data analysts could ask “Were the materials helpful and organized?” and other positive questions, as opposed to letting the participants share their honest thoughts. In this way, the study won’t extract any useful data, only biased opinions:
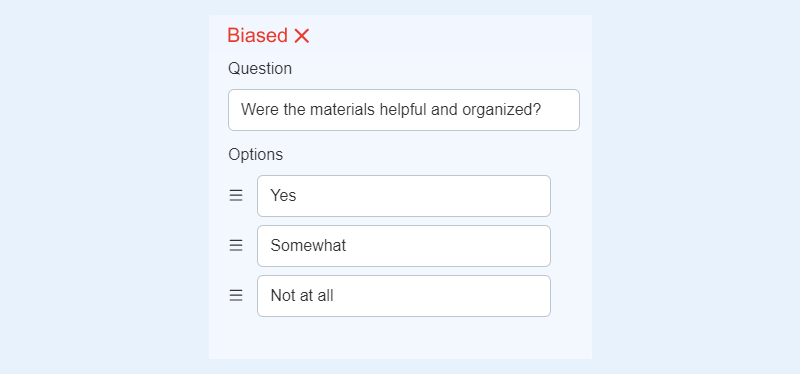
A non-biased, or neutral, question in this case would be “Were the materials helpful?”
How to spot this technique:
-
Look at the questions asked: In most surveys, the brand will mention the questions they asked participants. See if they asked for negative/constructive feedback or offered an area for participants to share their honest feelings.
-
Percentages: Many examples of misleading statistics in advertising will post the results in percentages, i.e., 75% of marketers found this tool effective. This shows the data analysts asked the participants the same question and likely gave them multiple-choice options as a response.
-
Emotional responses: Advertisers often capture leads with emotions, so surveys may show the emotional connection participants had with a product; i.e., 60% of kids loved the taste of our peanut butter. This doesn’t show any constructive criticism or insights into the product.
Misleading Averages
Many advertisers will state “averages” to avoid any biases. In reality, the number can be inflated and over-exaggerated. This especially happens when researchers use data fishing (or data dredging). For example: A company promoting a car seat with a message like “the average new parent loves our car seat for the safety and easy installation.” In reality, the company may not know how many new parents prefer their car seats over the competition, or only a small handful responded to their survey. Still, stating “average” rather than delivering conclusive data looks better in advertising. How to spot this technique:
-
Not willing to tell the whole story: A brand can use “averages” in their advertising, but without conclusive data, their claims are misleading.
-
Look for inequalities: When discussing “averages,” some companies may conform to biases or assumptions. Using the car seat example, a brand may say “the average mother” rather than “the average father” or “the average parent.”
Us vs. Them Content
Brands may compare their products and services to competitors to offer themselves as an alternative. But since they’re promoting themselves as the better option to the other brands, their arguments tend to sound one-sided and biased. For example: One lead generation marketing company may write a blog comparing their services to a competitor. Instead of offering valuable insight into both services, the brand may make the blog a promotional piece and shoot down the other company. How to spot this technique:
-
Vague critiques: Since the brand posting the blog is trying to attract clients, they will use vague arguments to explain why they shouldn’t do business with the other company and offer more detailed reasons to use their services.
-
Draw conclusions quickly: The main company will critique the other company without offering screenshots, videos or proof that they used their products.
-
Affiliate links: Even if a company doesn’t publish the blog on its own, it may partner with bloggers who will post the content for them – siding with the company doing business with them.
Sneaky Percentages
Percentages are an easy way for consumers to view data. But when percentages are presented without accompanying information on how the data was collected, it’s hard to assess the accuracy and reliability of these figures. Without knowing the sample size, the demographic of the respondents, or the methodology used in data collection, a percentage figure can be misleading. For example: An advertising firm may release a case study saying they converted leads for “80% of clients.” Even though this number looks promising, it’s extremely vague. Does that figure represent the entirety of their clientele or just a small number? And what means did the company use to collect that data? How to spot this technique:
-
Vague percentages: Some brands may find that 3 out of 8 clients responded negatively to their products but may not state that percentage as 37.5%. Instead, they may round it up to 38% or say “nearly 40%).
-
Look for raw numbers: That said, the brand could also state “3 out of 8” instead of a percentage.
Made-Up Numbers
And, of course, there are times when a brand will release statistics showing the effectiveness of their product… without even conducting a study. They make up numbers to use in their advertising campaign to entice people to buy. For example: A healthy food company can say 55% of their customers experienced lower blood pressure when eating their meals, without any data to support this claim. And because few people will do their own research and look into these claims, they’ll just believe it because it’s printed on the package of the product. How to spot this technique:
-
Too good to be true marketing: Making a claim like “one meal can lower your blood pressure” is unrealistic. Use your best instinct to identify what’s real and what’s snake oil.
-
Check different resources: If a brand makes any fraudulent claim, it will receive a fine from the FTC. Do some research, or a quick Google search at the least, to see if the business received past warnings and fines.
7 Examples of Misleading Statistics in Advertising
There are numerous case studies of the misuse of statistics in advertising, and these can provide valuable insights into how these techniques are used in practice. Here we’ll take a look at some common examples of misleading statistics.
Sephora and Clean Beauty Ad
With so many beauty products, consumers want to feel comfortable knowing what they put on their skin. That’s why the “clean beauty” movement took consumers by storm, making them feel more trusting of products without dangerous ingredients, harsh chemicals or fragrances. However, debate opened up in the beauty industry, with many asking “What is clean beauty?” There’s very little monitoring over these products and a set “clean” standard to adhere to. That’s why mega beauty brand Sephora got in trouble with a “clean beauty” ad, and now it’s facing a lawsuit for false advertising:
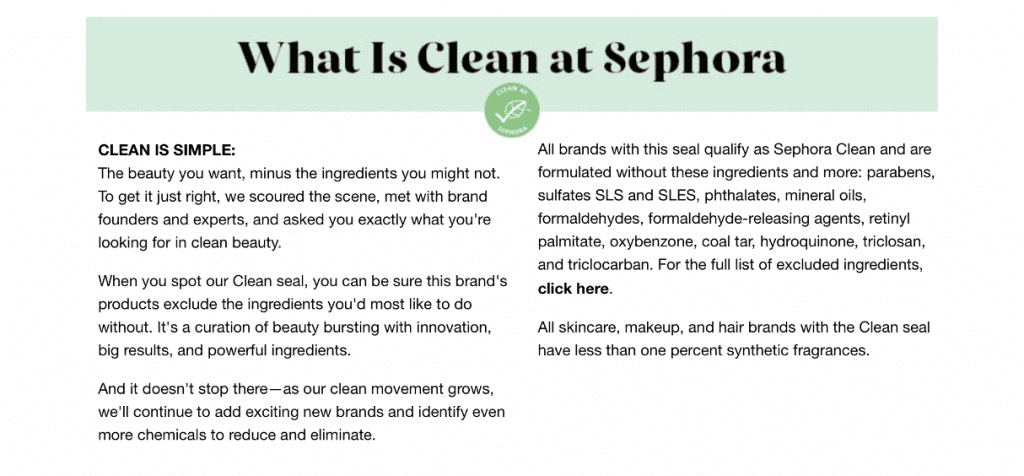
Sephora was promoting their line as “clean,” but it still contained synthetic and harmful ingredients. The plaintiff claimed this was deceptive because not only did the company indulge in false advertising, but they charged more for these products. What has Sephora said? On their website, they state that products in their clean line don’t contain parabens, mineral oils, phthalates, formaldehyde, or the sulfates SLES and SLS. At the same time, the plaintiff says this is inconsistent with the consumer view of “clean” beauty, which states that the product is free of all synthetic ingredients. This lawsuit details a major problem: our understanding of clean beauty. If you do a Google search of “clean beauty,” numerous websites will have different claims – some state that clean beauty is free of the ingredients detailed by Sephora, while others state that the product is made of only natural ingredients. Until a regulatory body offers a specific definition of “clean” beauty, brands must label their products as “clean” with caution, or else face a similar false advertising lawsuit.
Teami and Unsubstantiated Health Benefits
When Teami was first formed in 2013, it seemed to be a promising brand. They used fun and trendy social media posts and impressive influencer collaborations to promote their healthy teas. Or was there more than meets the eye with this company? It only takes a quick glance at this blog to see Teami making serious medical claims:
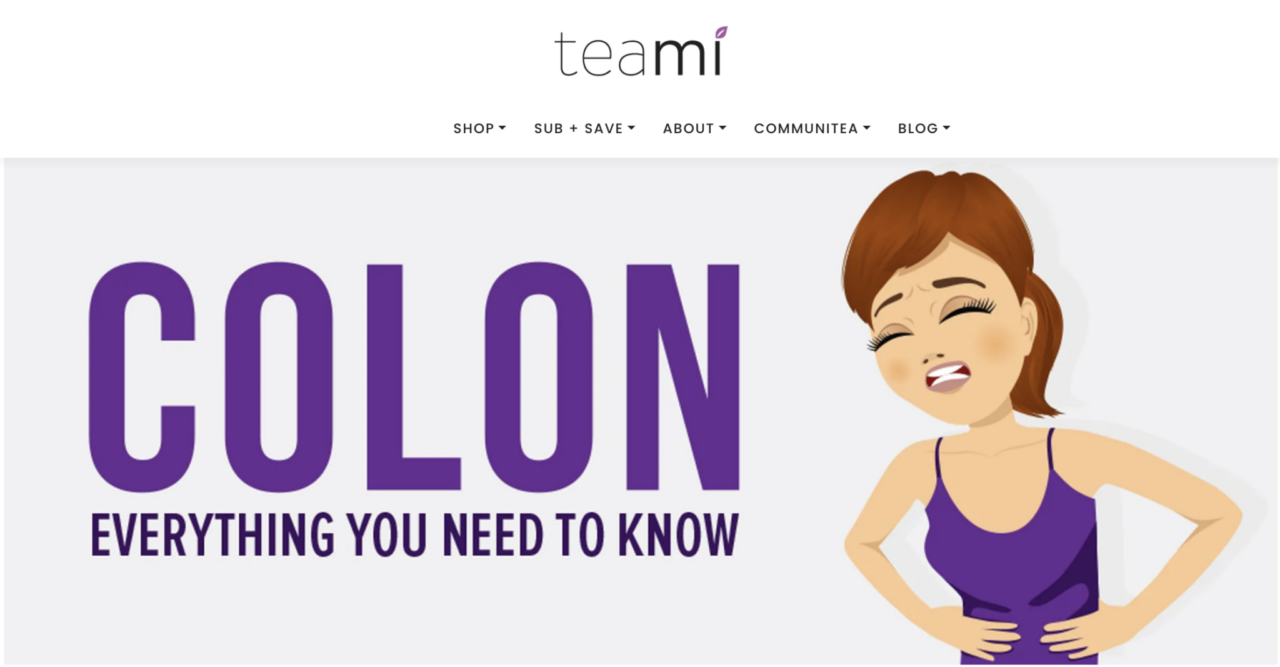
In the first paragraph alone, they state that you have toxins lining the inside of your colon walls. But is this true? What facts and sources do they have to back up this claim? This wasn’t enough for the FTC. They sued Teami, LLC, the company’s CEO, Adi Halevy, and Yogev Malul, an officer of Teami. In the lawsuit, numerous influencers who branded with Teami, who failed to mention they were being paid to advertise these teas, were also mentioned. The lawsuit centered around their deceptive ads and touting the health benefits of their products. In the lawsuit, they point out specific teas and the medical claims each makes in their advertising, such as how the Teami Profit tea unclogs arteries and fights cancer cells. In 2022, the FTC refunded Teami consumers with a check worth no more than $45 each, totaling a payout of more than $930,000.
Bang Energy Super Creatine Ad
Since so many of us live busy lives, there are always plenty of brands and products emerging to keep us on the go. Bang Energy is one example. With plenty of caffeine and over 40 “fun flavors”, Bang Energy promises to provide an “explosive boost of energy.” However, the energy drink market is oversaturated. Bang Energy had to get creative with its advertising to separate itself from competitors. And their tactic was taking advantage of the fitness industry and the nutrients workout enthusiasts use to enhance gym performance. Bang Energy started promoting their drinks as containing “super creatine“:

The problem is that super creatine doesn’t exist. Creatine is a naturally made compound that supplies energy to your muscles and is also found in protein-rich foods. This claim caught the attention of competitor Monster Energy, who sued Bang over false advertising laws in 2023. Monster’s argument was that Bang used this misleading claim to take away business from them, and Monster was awarded $293 million. As a result, Vital Pharmaceuticals, Inc., Bang’s parent company, filed for Chapter 11 bankruptcy. A few months later, Monster agreed to buy Bang. However, the FTC still must review this deal.
Hey Dude Shoes Suppressed Negative Customer Reviews
Customer reviews are an essential way for consumers to research products. So when a brand removes their negative reviews, they don’t have an unbiased product research method. That’s why Hey Dude Shoes was fined when they suppressed 80% of reviews with less than four-star ratings in 2020-2022. Hey Dude Shoes did this by relying on a third-party review platform, where they rejected or didn’t post less favorable reviews. In addition, Hey Dude Shoes failed to cancel customer orders, never issued shipping delay notices, and gave gift cards instead of refunding the order to the original form of payment.

The FTC stated that this violated the Mail, Internet, and Telephone Order Rule, and Hey Dude Shoes were fined $1.95 million. These funds will be used to refund customers.
Activia Yogurt Overstated Its Health Benefits
We would like to think healthy food products are being honest about the health benefits they’re touting, but that isn’t always the case. This happened to Activia Yogurt and its parent company, Dannon:
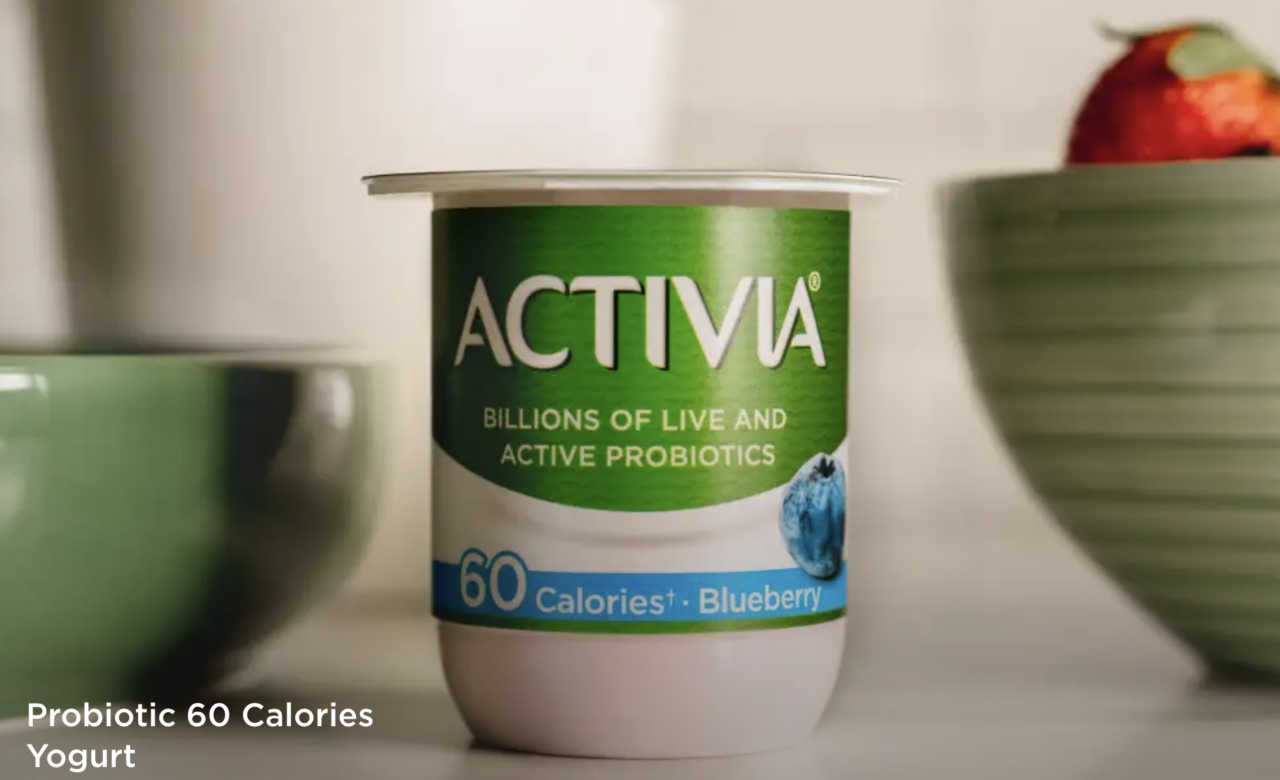
The company faced a class-action lawsuit in California, and the plaintiff alleged the company used false advertising to make unsupported health claims in their marketing, exaggerating the benefits of their yogurt. Some of their statements include “regulate one’s digestive system” and using a false name of a probiotic bacterium (Activia used different variations of this term throughout the US, Canada, and UK). This lawsuit also alleged that because of the false advertising statistics, the company inflated the price of their yogurt. As a result of the lawsuit, Dannon agreed to change its ad copy and drop the health claims.
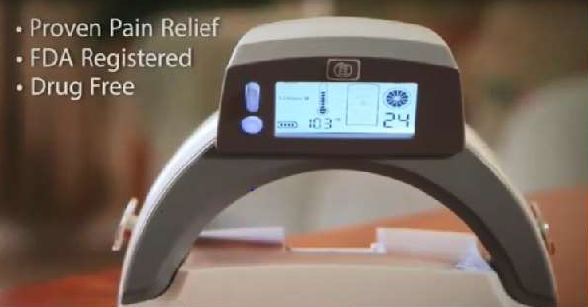
Low-Level Light Therapy Device Claims It Treats Chronic Pain
Living with chronic pain is unbearable, and many patients are finding alternatives to pharmaceuticals. This caused many companies to tout non-conventional treatments to target vulnerable patients, including new technologies like low-level light therapy (LLLT). An example is Willow Curve, an LLLT device that claimed it treated severe pain. Ever since it was developed in 2014, the marketing stated this was a “smart device” that that “clinically proven” to reduce pain and inflammation. The FTC challenged this claim as false advertising since it lacked scientific data to support its “clinically proven” status. In addition, Willow Curve falsely stated the FDA approved it, used deceptive native ads in their campaign, and had a bogus money-back guarantee.
The FTC imposed a $22 million judgment on Physician Technology, LLC and Willow Labs, LLC.
Sobriety Supplement Relied on Paid Endorsements and Fake Reviews
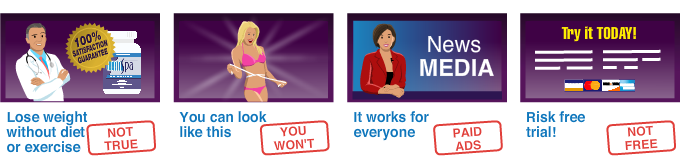
Recovering from alcohol addiction is difficult, and those wanting to enjoy a sober life may rely on products to help them curb their cravings. Unfortunately, this vulnerability can attract fraudulent companies. Sobrenix is an example. This supplement is made by Rejuvica and targets those recovering from alcohol addiction. They used deceptive advertising to claim their supplements reduced alcohol cravings – with no evidence to back it up. In reality, the supplement is made of kudzu root and various vitamins and minerals. Not only that, but Rejuvica promoted the supplement using paid endorsements, though the endorsements failed to address their collaborations with the brand. In addition, Rejuvica created fake review websites and the company staff members left ratings on these bogus sites (the image below is tongue-in-cheek):

As a result, Rejuvica must pay $650,000 to the FTC, which they will use to refund customers.
Related Content (with Sources!): * 75+ CRO Statistics That’ll Help You Increase Sales in 2023 * 100 SEO Statistics That’ll Help You Dominate Search Rankings in 2023
Combating False Advertising Statistics
The use of misleading statistics in advertising has a significant impact on consumer trust and decision-making. When consumers are presented with misleading information, they may make an uninformed decision, ultimately harming their health or finances. This can lead to a loss of trust in the advertising industry, and consumers may become skeptical of any advertising claims they encounter. As consumers become more aware of data fishing and other techniques used to manipulate advertising, they are demanding more transparency and honesty from companies. This has led to the rise of several organizations that play a role in regulating advertising to provide consumers with accurate information about products.
Advertising Standards Authority (ASA)
The Advertising Standards Authority (ASA) is the UK’s independent advertising regulator across all media. Its role is to ensure that advertising is legal and only makes truthful statements. The ASA has specific guidelines on using statistics in advertising and actively monitors ads to ensure they comply with them.
Federal Trade Commission (FTC)
The Federal Trade Commission (FTC) is the U.S.’s consumer protection agency. It can take legal action against companies that engage in deceptive practices, including using false advertising statistics. The FTC takes a proactive approach to protecting consumers and takes action against companies that use false advertising claims. Consumer advocacy groups often have close relationships with these regulatory bodies, which allows them to advocate for consumer rights and raise awareness of deceptive advertising practices. You can report fraudulent product claims and misleading online and print ads to:
-
The FTC at ReportFraud.ftc.gov
-
Or to your state attorney general‘s consumer protection site
Independent Product Reviews
Independent product reviews are conducted by impartial experts or everyday consumers who test and evaluate products based on various criteria such as performance, quality, durability, and value for money. These reviews offer valuable insights into the strengths and weaknesses of products, allowing potential buyers to weigh their options objectively. Numerous independent product review sites provide unbiased assessments and evaluations of a wide range of products, including:
-
Consumer Reports: This reputable nonprofit organization conducts extensive testing and research on various consumer products. They provide in-depth reviews, ratings, and buying guides to help consumers make informed decisions.
-
Wirecutter: This site, owned by The New York Times, offers expert reviews and recommendations on various products. Their team of experienced journalists and experts thoroughly researches and tests products to provide unbiased and reliable information.
-
CNET: This is a trusted technology and consumer electronics review site. They provide comprehensive reviews, ratings, and buying advice on products ranging from smartphones and laptops to home appliances and smart gadgets.
-
Good Housekeeping: This popular magazine and website features independent product reviews across various categories, including home appliances, beauty products, and household items. Their experts rigorously test products to assess their performance, safety, and overall value.
-
TripAdvisor: This well-known platform for travel-related reviews and recommendations allows users to share their experiences and provide feedback on hotels, restaurants, attractions, and more, helping travelers make informed choices.
-
Yelp: This is a widely used platform that allows consumers to review and rate local businesses, including restaurants, retail stores, and service providers. It provides a community-driven platform where people can share their experiences and opinions.
It’s worth noting that while these sites strive to provide unbiased information, it’s always a good idea to consider multiple sources and reviews to form a well-rounded perspective.
Consumer Watchdog Groups
A consumer watchdog group is an organization or entity that actively monitors and investigates business practices, products, and services to protect consumers and ensure fair and ethical practices in the marketplace. They scrutinize false advertising claims and practices to identify instances of misleading statistics or deceptive marketing techniques in an effort to hold companies accountable and enhance public interest. The most common consumer watchdog groups include:
-
Consumer Federation of America: CFA is a nonprofit organization that advocates for consumer rights and protections. They conduct research, education, and advocacy campaigns on consumer issues, such as product safety, financial services, and consumer privacy.
-
Public Citizen: This is a nonprofit organization that focuses on consumer advocacy and corporate accountability. They work to protect consumer interests in areas such as healthcare, product safety, and financial regulation while also promoting transparency and fair trade practices.
-
Better Business Bureau: The BBB is a nonprofit organization that acts as an intermediary between businesses and consumers. They provide ratings, reviews, and dispute resolution services to help consumers make informed choices and address complaints against businesses.
This rise in demand for transparency and the availability of independent resources has encouraged companies to be more cautious in their advertising practices. Many businesses now recognize the importance of building trust and credibility with customers by providing accurate and reliable information. Consequently, some companies have embraced transparency initiatives, such as disclosing their sourcing methods, manufacturing processes, or third-party certifications, to demonstrate their commitment to honesty and authenticity.
Last Word on Misleading Statistics in Advertising
Misleading statistics and false advertising are completely wrong and can have a significant impact on consumer trust and decision-making. One of the few mistakes consumers can make when buying is not questioning ads. It is essential for consumers to be aware of these techniques to make informed decisions about the products and services they choose to buy. By understanding the techniques used to manipulate numerical data in advertising and the role of regulatory bodies in combating this issue, consumers can help to ensure that advertising claims are accurate and not misleading.
If you’re ready to level up your business with trust and transparency, Single Grain’s paid ads experts can help!👇
Advertisers may use cherry-picked data, ambiguous claims, small sample sizes, or out-of-context statistics to present misleading information and make products or services appear more favorable. That’s why you should keep your eyes peeled for every source people reference. If they don’t reference the source of their findings anywhere, then take what they claim with a big grain of salt. Cherry-picking often involves selecting only the data that supports a specific message while ignoring contradictory evidence. Look for statements that lack full context or omit relevant details. Vague metrics, like “up to” statements, create flexibility in claims without offering specific guarantees. This tactic makes results seem more impressive but harder to verify, allowing brands to justify larger claims by keeping their metrics unclear. Keeping their claims ambiguous can allow them to twist a narrative beyond the reasonable application, allowing them to make broader claims without real hard figures to back up what they’re saying. Naturally, that makes it easier for them to pioneer their statements, but at the cost of muddling readers and clients with insufficient evidence. Misleading statistics can damage consumer trust and harm brand reputation if audiences feel misled. Over time, this can lead to loss of customer loyalty and decreased credibility. Be cautious of claims that use percentages without clear context, stats without sample size information, and overly broad statements that lack specific supporting data. Brands can build trust by using clear, accurate statistics, providing context for their data, and avoiding exaggerated claims. Transparent advertising helps build long-term customer loyalty.
Frequently Asked Questions on Misleading Advertising Statistics
Related Video
https://www.youtube.com/watch?v=7RmRuFUPpa8 For more insights and lessons about marketing, check out our Marketing School podcast on YouTube. Additional content contributed by Stephanie Jensen and Sam Pak.