8 Essential SEO Reports to Create for Your Client
Reporting has always been an integral part of search engine optimization.
A quality SEO report is necessary to ensure that you or your clients can easily measure and compare (with previous reports) the ROI from their online marketing. That’s how you know whether your business is growing or not.
Generally, pulling a monthly report is sufficient – more frequently is a waste of time, and less frequently won’t keep you on track as well.
Think of an SEO report like the report card you received every semester in school: it’s a concise and detailed summary of your performance in the various subjects you were (allegedly) learning. When you received a C+ in math, that showed you that you had to work harder to improve, and when you received an A in history, you could rest assured (for the time being, anyway) that you were competent in that subject.

The growth of voice search, the inclusion of featured snippets, the rise of zero-click searches and the importance of a better UX all contribute to how you present your SEO report to your clients.
Older SEO metrics like content and backlinks are still as important as ever, so you shouldn’t ignore these ones in favor of the newer, “sexier” voice and zero-click search metrics when sharing reports data with your clients.
Let’s learn why it’s crucial to prepare a quality SEO report and then how to do it in 8 simple steps.

TABLE OF CONTENTS:
- Why SEO Reporting Is Important
- Prepare Your 2020 SEO Reports in 8 Steps
- Step 1: Define Your KPIs
- Step 2: Prepare a Site Health Report
- Step 3: Prepare an Organic Traffic and Engagement Report
- Step 4: Prepare an Organic Conversions Report
- Step 5: Prepare a Backlink Analysis Report
- Step 6: Prepare a Ranking Report
- Step 7: Prepare a Featured Snippets/Voice Search Report
- Step 8: Prepare a Site Content Report
- Wrapping Up
Why SEO Reporting Is Important
It is important to show your clients that your SEO efforts are working and, therefore, is worth the hard-earned cash they’re shelling out to your SEO or digital marketing agency.
But you don’t want to just copy and paste tons of data into a spreadsheet and email it to your client with a note saying “Good luck!” Not only will you likely wind up including irrelevant info and numbers, but that’s not helpful to your client.
A good SEO report is one in which you, the SEO expert, culls relevant data, analyzes it to understand what it means, summarizes it in a way that your client (i.e. not an SEO expert) can understand, and then provides actionable next steps.
Preparing a detailed and easy-to-understand report is the only way to make your clients believe that your expertise and knowledge are benefitting them.
Creating insightful SEO reports is important to:
- Determine the effectiveness of your SEO strategy
- Identify areas of your site that need improvement
- Understand what your website visitors are looking for and where they’re facing problems on your site
- Find the best- and worst-performing content so you can optimize your content marketing strategy accordingly
- Detect trends in consumer needs
- Measure conversion rates
- Measure the client’s return on investment
Dive Deeper:
- 9 Effective SEO Techniques to Drive Organic Traffic
- Now that You’ve Hired an SEO Company, What Should You Expect from Them?
- SEO: How to Help Your Client Understand that Ranking Takes Time
Prepare Your 2020 SEO Reports in 8 Steps
Your clients should be able to understand your report easily, so don’t prepare confusing SEO reports that take hours to reveal the underlying meaning of the numbers mentioned in it. Your SEO report should be relevant, engaging (yes, engaging!) and easy to understand. Here are eight steps to prepare a great SEO report:
Step 1: Define Your KPIs
While it might be tempting for you to simply download the keyword rankings and organic traffic reports and show them to your client, that might not be enough to showcase your overall SEO plan.
First things first: Always discuss with your client (or your own team, if you’re preparing these reports in-house) what their goals are so you know what to include in the report. Clearly defining the Key Performance Indicators (KPIs) and how you plan to achieve them will help you conclusively demonstrate how you have moved towards those objectives with the data presented in the report.
Here are a few important SEO metrics you should include in your report:
- Links: Links remain an important ranking factor. A study published on Moz found that there is, indeed, a strong correlation between links and rankings. You must pay close attention to your backlink profiles, especially given the March 2019 Core Update, which focuses on “Google favoring websites, particularly when users are searching for sensitive YMYL keywords, that are able to provide a higher level of trust.”
- Site Ranking: The organic traffic a site receives is directly proportional to its position in the SERPs. In 2019, the first five organic results in Google received 67.60% of all clicks, with the first position alone getting 31.7%. Also, moving up a single position in Google increases relative CTR by 30.8%. This means that tracking organic rankings is as important as ever. You must track organic rankings and clearly mention how many positions the site has gone up or down in the rankings.
- Organic Search Traffic: Tracking organic traffic – by landing page and location – is the best way to measure the impact of your SEO strategy. This will help you determine the pages that are receiving the highest organic traffic and identify the pages that still need improvement. You can place your CTA in the highest-traffic pages to increase your conversions.
- Organic Conversion Rate: Maybe your site attracts thousands of visitors each month, but if it does not convert, all your SEO efforts are wasted. Hence, you must clearly specify in your reports both traffic and conversions. It is important to note that “conversion” is not equivalent to “sale”. For example, a visitor filling out a form can be tracked as a conversion but that doesn’t necessarily contribute to a sale.
- Inbound Marketing ROI: Calculating your inbound marketing ROI helps evaluate your monthly and annual performance in terms of revenue. It will also help you determine which SEO strategy requires more investment in the coming days and months and which tasks are merely wasting the budget.
- Customer Lifetime Value: This KPI will help you determine how much a customer is worth for a business.
- Sales Revenue: Clients definitely want to know the amount of sales they were able to generate per quarter. By tracking sales revenue, you can demonstrate the effectiveness of your SEO campaigns.
- Cost Per Lead: This will tell you how much your SEO efforts are costing the client to generate a lead. A comparison with PPC cost per lead will clearly determine the supremacy of one channel over the other.
- Page and Domain Authority: PA and DA help you determine the ability of a specific page/domain to rank in the search engines. Tracking this metric and comparing it with your closest competitor will help you determine the amount of effort needed to get the best results for your clients.
With all these KPIs in mind, let’s move to the second step – preparing site health reports.
Dive Deeper:
- The Only 4 Marketing/Content Marketing KPIs That Really Matter
- 12 Reasons Your SEO Strategy Is Failing
- The Best Way to Track Your Keyword Rankings: An SEO Expert’s Strategy
Step 2: Prepare a Site Health Report
A website’s overall health has a huge impact on SEO.
Much like the physical health metrics that your doctor assesses each year at an annual physical check-up – blood pressure, heart, lungs, neurology, eyes, ears – a website’s health must be assessed before any other steps are taken so you can see what you’re working with. Page loading time, broken links, bounce rate and session duration are some of the metrics that impact site rankings.
Here are the most important metrics you must include in your site health report:
- Indexed pages
- Site speed
- AMP elements
- Schema markup
- Server response time
- Crawl errors
- Broken links
- Missing or duplicate meta tags
- Page crawled per day
- Bad redirects
- Time spent downloading pages
- Security issues
- Domain authority and page authority
- URL Structure
You can check the health of your website with tools like Ubersuggest, Woorank and SEO Site Checkup.
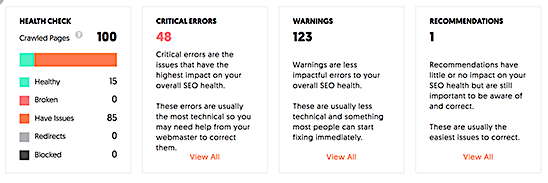
Ubersuggest will track various issues like site speed, broken links, redirects, blocked pages, security issues, low word count, etc., and give you a summary of the health check:
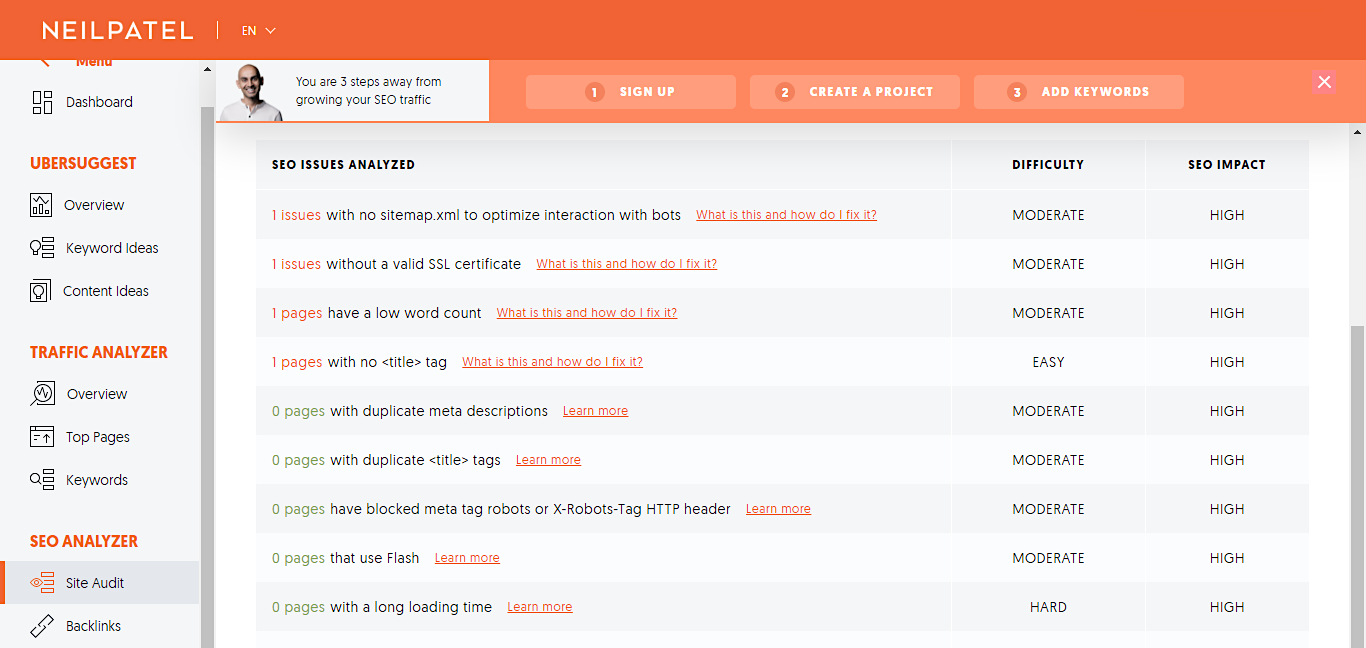
It also shows how much impact a specific issue has on your SEO and provides recommendations on how to fix those problems:
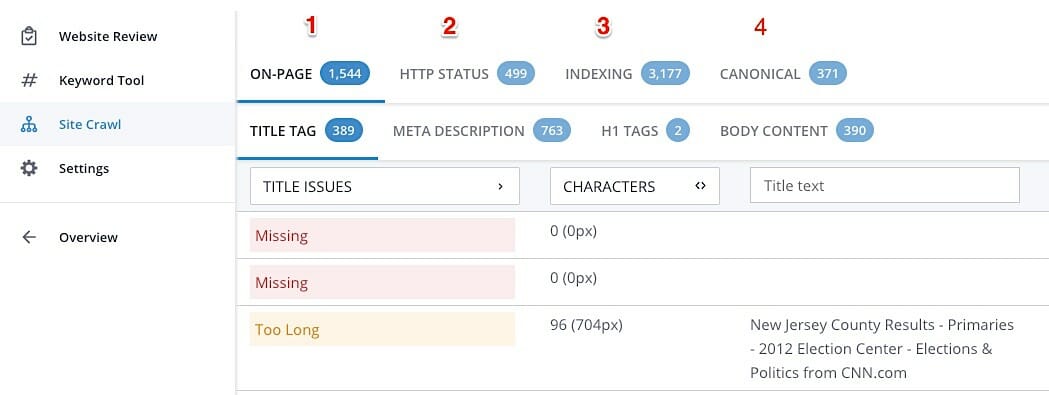
Woorank can help you find issues that could be affecting your SEO, such as on-page problems, HTTP status, indexing, return tag errors, and canonicalization concerns, with its site crawl tool. It then color codes the results (red, orange, blue) to help you prioritize what needs to be attended to first:
The two major advantages of using Woorank are:
- It ensures that search engines can crawl and understand your content.
- It lets you export the technical SEO report data in the form of a PDF. You can share this PDF with your clients (if they have a separate developer team) or download the report yourself and implement the changes for effective site optimization.
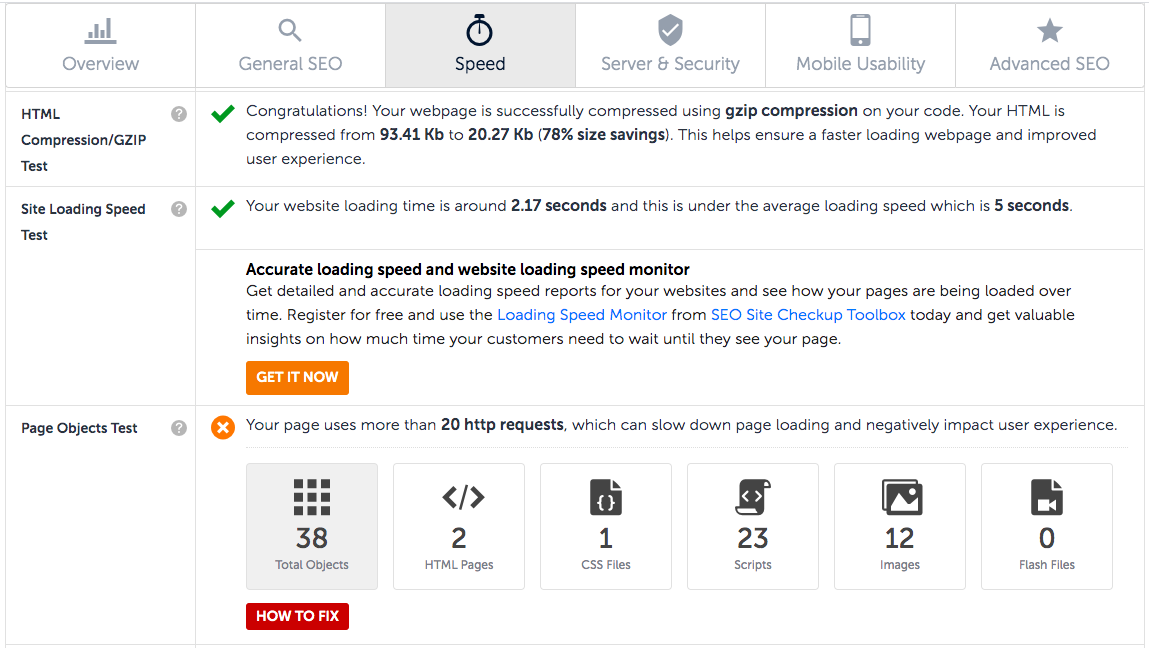
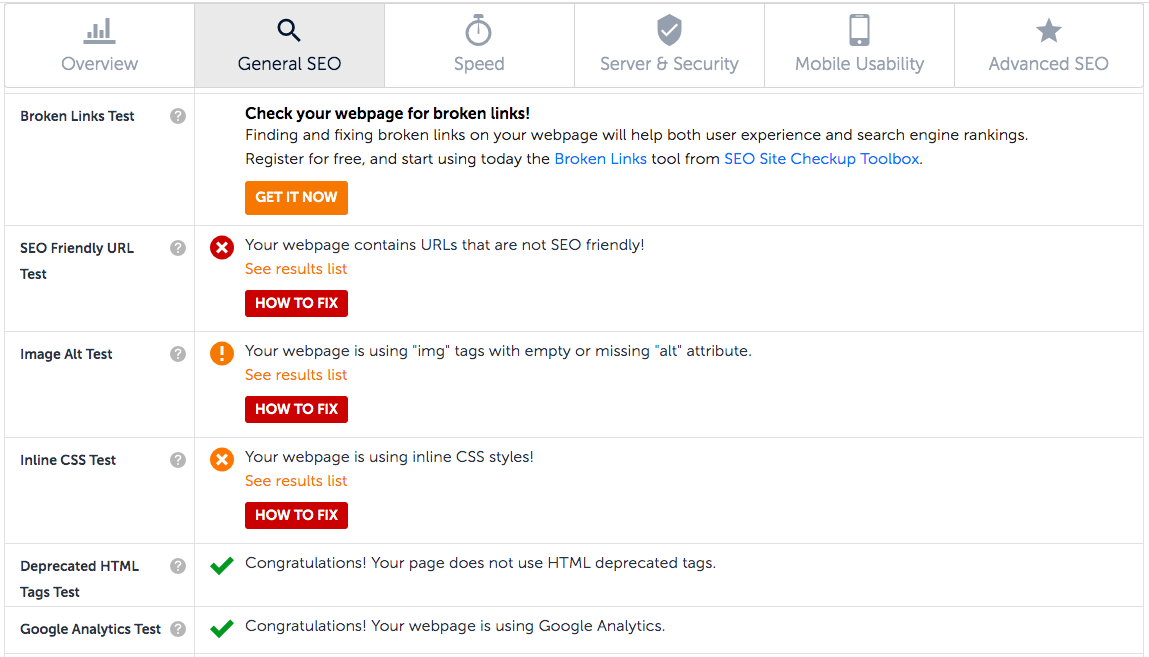
SEO Site Checkup checks sitemap, robots.txt, site speed, security, mobile-usability, redirects, and other issues.
All you have to do is enter your site’s URL, and it will return a full SEO report. As you can see in the below images, this tool displays the number of HTTP requests made, the page loading time, and issues in the URL structure.
Additionally, you can monitor the AMP (Accelerated Mobile Pages) elements. AMP helps speed up site loading for mobile users. However, it does not offer as many on-page elements as their non-AMP counterparts, so it is important to test the validity of your AMP pages using the AMP test tool.
At the end, include a summary for your client of the next steps to take in order to fix the issues identified.
Step 3: Prepare an Organic Traffic and Engagement Report
When preparing an organic traffic and engagement report, mention how the site was performing before you started the work and what progress was made up until now. This will help you highlight the improvements made in a given time period.
Here are a few metrics you must include in your organic traffic and engagement report:
- Organic channel report (Google vs. Bing vs. Yahoo)
- Pageviews
- Pages per session
- Time spent on page and average session duration
- Organic CTR
- Organic visits by location and device
- Bounce rate
- Scroll depth
- New vs. returning visitors
- Exit rate and top exit pages
- Frequency of return users
- New subscribers
- The number of shares/comments
- Goal conversion and event tracking
You can check the metrics mentioned above using tools like SEMrush, Hubspot, Ahrefs, Google Search Console, Hotjar and Crazy Egg.
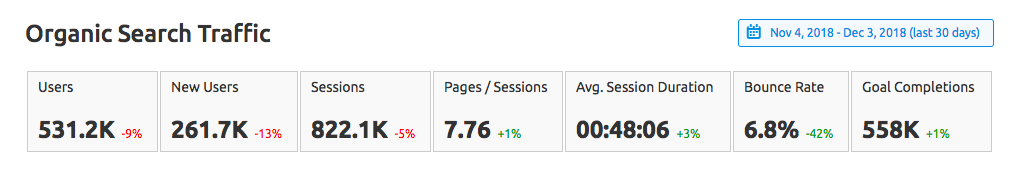
SEMrush lets you track the number of new users, the click-through rate, new sessions, pages/session, bounce rate, rankings and several other metrics for your organic search traffic. Depending on your project goals, you can compare several metrics within a previous period:
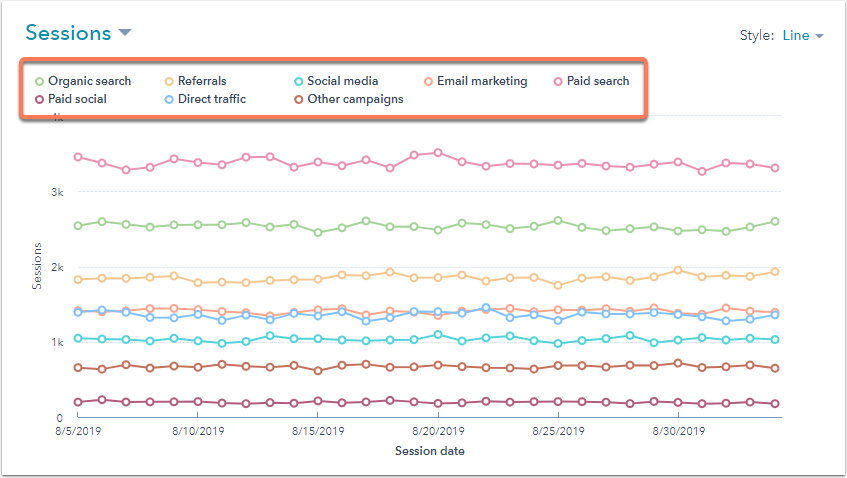
 Hubspot can track most of the metrics that SEMrush does, in addition to providing a month-over-month traffic report for easy comparison:
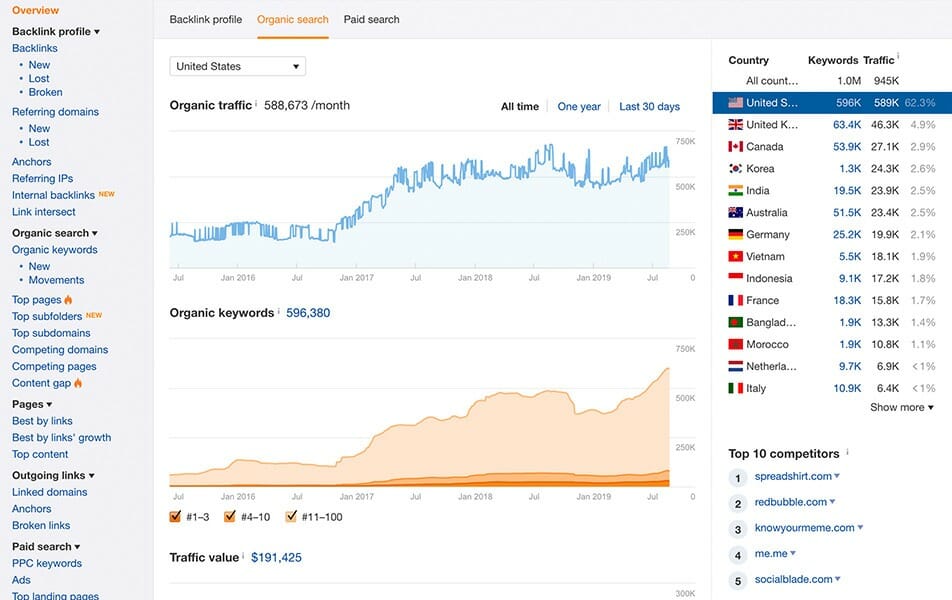
Ahrefs tracks global organic traffic. It also enables you to filter incoming traffic by location so you can see where most of your audience comes from. This is helpful, as it allows you to create location-specific campaigns and further boost organic traffic. You can compare organic traffic month-over-month and year-on-year for each page group or category:
Google Search Console lets you track the share of search traffic from “generic” phrases versus “branded” phrases. A well-executed SEO campaign has more traffic from non-branded search terms.
Click on Performance > +New > Query:
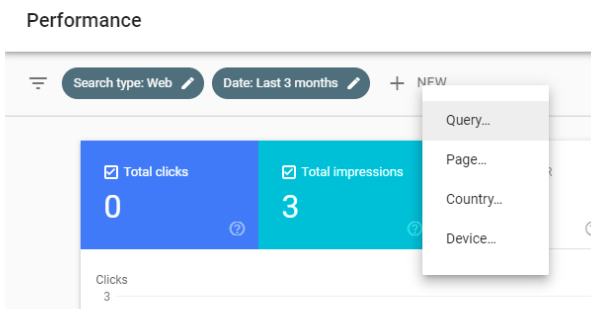
Enter your brand name and filter by Queries containing:
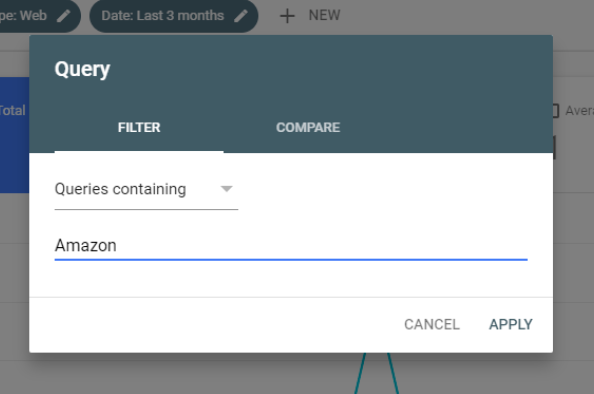
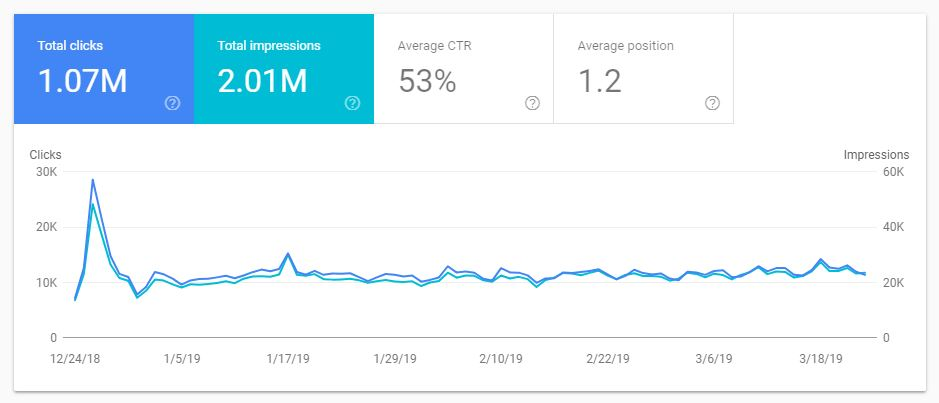
You will then see the total number of branded clicks and impressions your site receives for branded terms:
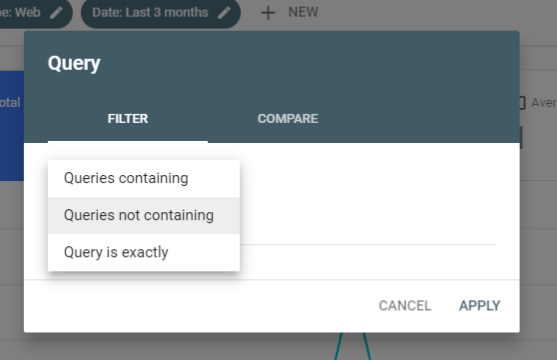
To track the share of search traffic from generic phrases, change the filter to Queries not containing:
Hotjar lets you track scroll depth to understand how thoroughly your audience consumes your content and where on the page they stop reading the content. This tool lets you visualize mouse movements, where visitors click, and what they look at or ignore.
There are different, specific types of heat maps, such as scroll maps, click maps and move maps, which all help you better understand different aspects of your site’s performance.
The below image depicts a click map which, as you can imagine, shows you where visitors are clicking (or tapping) the most:

Crazy Egg tracks where your visitors are clicking, which parts of the page they are viewing, and user recordings which let you view real-time visitor engagements on your website. You can use the data provided by scroll depth and heat map measuring tools to optimize engagement metrics like time on page and bounce rate.
Dive Deeper:
- The Ultimate Guide to Conversion Rate Optimization
- How to Create Intent-Based Content to Improve Conversions
- [Case Study] The Content Sprout Method: How to Use Strategic Content Marketing to Grow Your Traffic From 0 to Millions
Step 4: Prepare an Organic Conversions Report
When preparing an organic conversions report, you’ll want to tell your client how their site was performing before as well as what the current status is. This will help you highlight improvements in organic conversions month-over-month or in any given time period.
Here are a few metrics you must include in your organic conversions report:
- Organic sales
- The number of form fills and calls
- New visitor conversion rate
- Returning visitor conversion rate
- Cart abandonment rate
- Cost per conversion
- Top/lowest converting landing pages
- Conversion by device and location
- Customer lifetime value
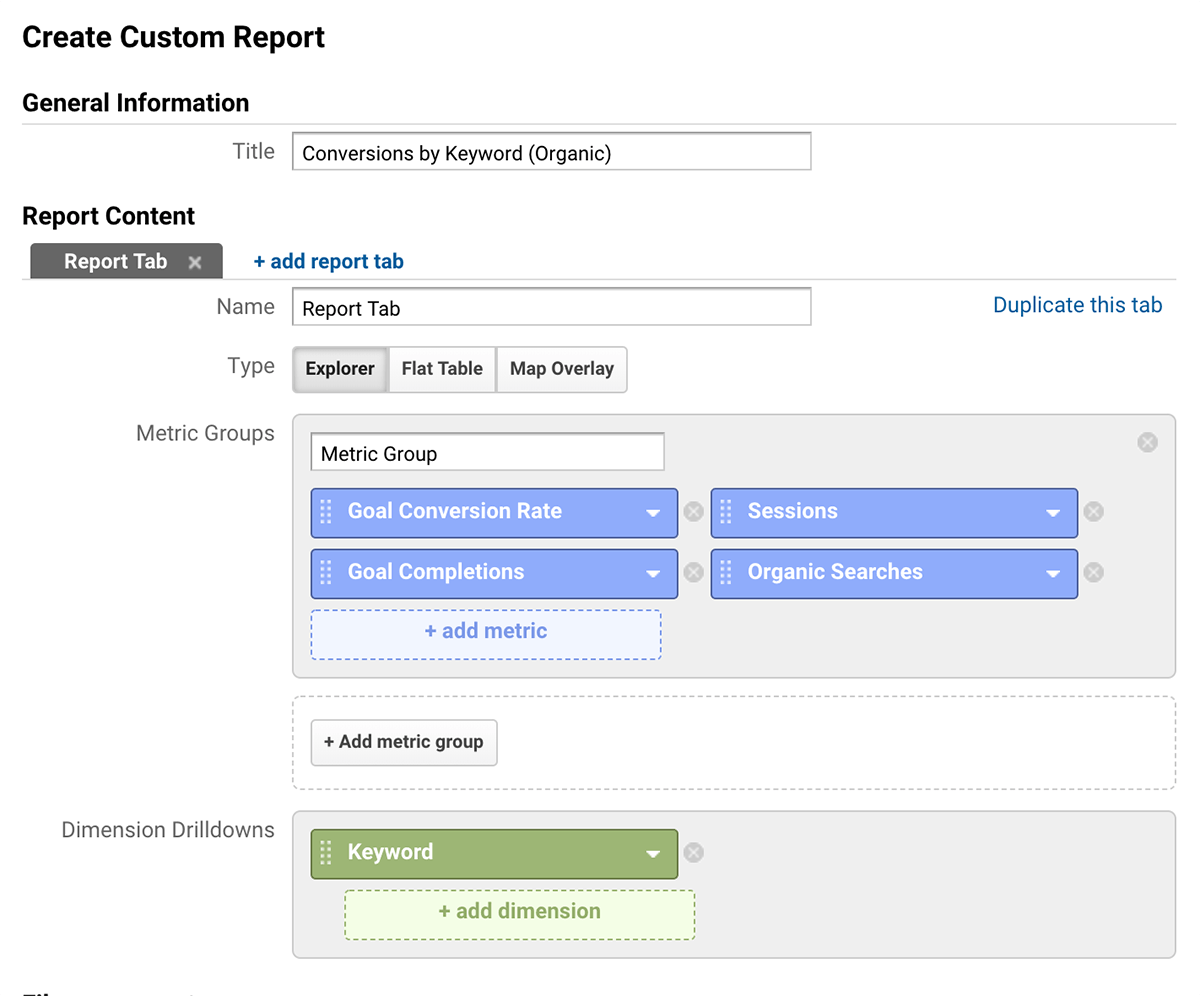
You can track organic conversion rates by creating a custom report with Google Analytics. Follow these steps to prepare a custom report:
- Log in to your Google Analytics account
- Choose the website for which you want to prepare a report from the list
- Click on the customization tab (in the left panel)
- Click on + New Custom Report
- Add relevant metrics (goal conversion rate, sessions, goal completions, organic searches) that you wish to track in the Metric Groups field:
- Save the report
Now you’ll be redirected to your new report. Always include a summary of the next steps to take in order to improve the performance of these metrics for your client.
Step 5: Prepare a Backlink Analysis Report
When preparing the backlink analysis report, mention how many backlinks the site has and how many links the site acquired recently. This will help you highlight the effectiveness of your link acquisition strategy.
Here are a few things you must include in your backlink analysis report:
- Link distribution ratio
- Dofollow vs. Nofollow links
- Percentage of exact match anchor text
- The number of links acquired in the past 30 days
- The ratio of the backlink to referring domains
- Domain and page authority
- Branded vs. non-branded anchor text
- Spam score of the domains
- Citation flow
- Trust flow
You can use tools like Moz, CognitiveSEO and Majestic to perform a backlink audit.
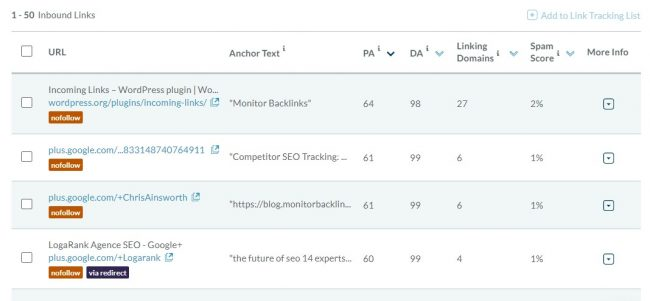
Moz lets you discover domains that link to your website, check their domain authority, the anchor text, the spam score of backlinks, and more. Analyzing the quality of inbound links helps you find the number of low-quality backlinks your site has that might increase the chances of a penalty:
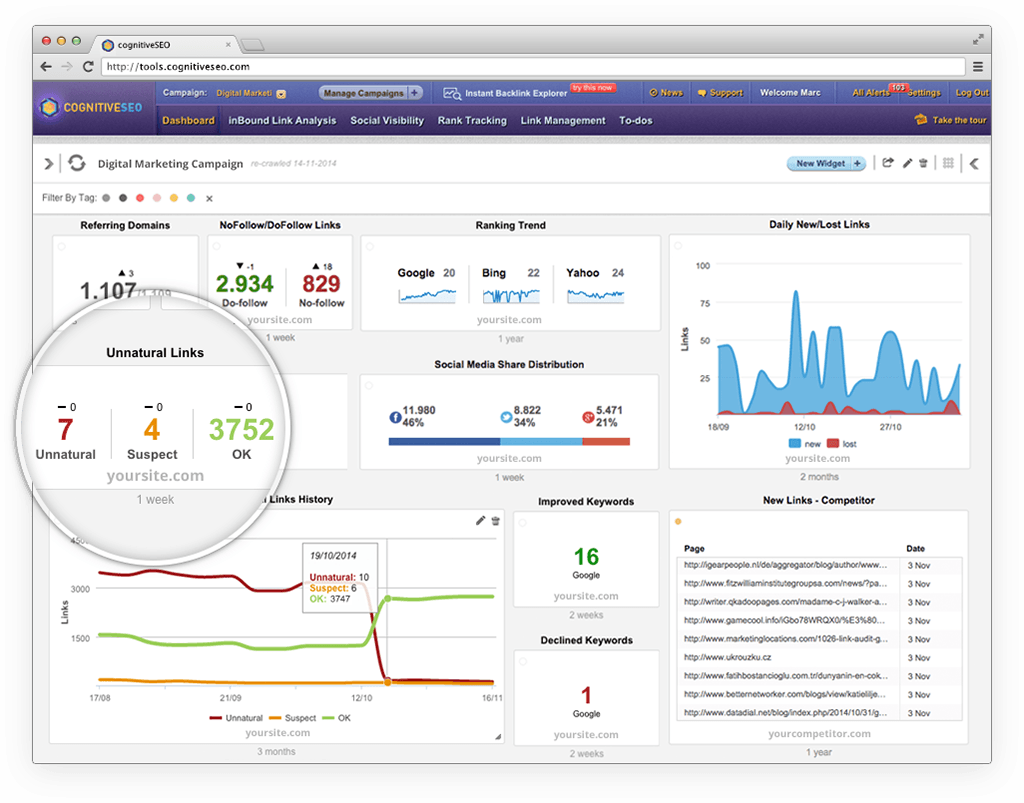
CognitiveSEO helps you visualize the naturalness of your entire link profile, enabling you to prevent search engine penalties. You can check the number of dofollow/nofollow links, the number of new links/lost links on a daily basis, the number of referring domains and the number of unnatural links to your site:
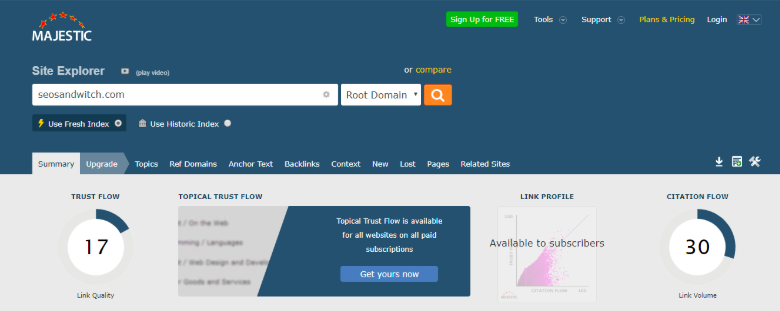
Majestic helps you track the total number of backlinks, referring domains, referring IPs, and subnets. It also displays trust flow, citation flow, link density, and top anchor texts.
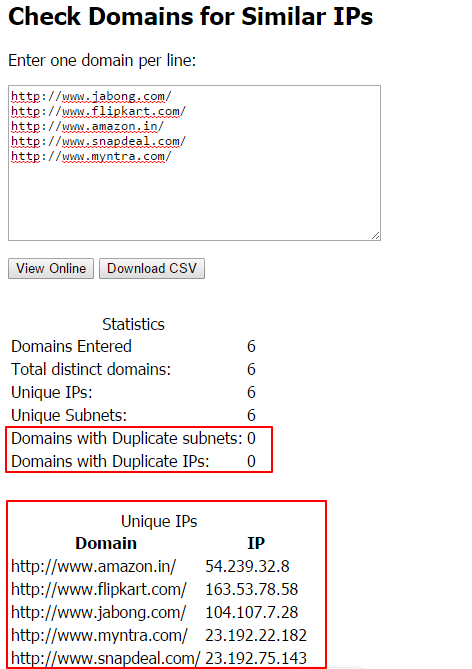
Monitor Backlinks can help you identify C-Class IPs easily. It is important to check the total number of C-class IPs to determine whether a link from a website is sharing an IP address with other websites. If the answer is yes, it can hurt your site’s PageRank.
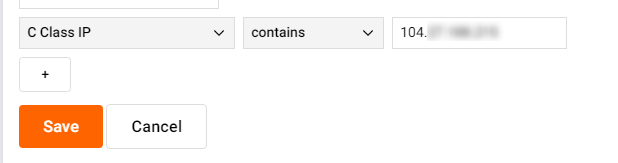
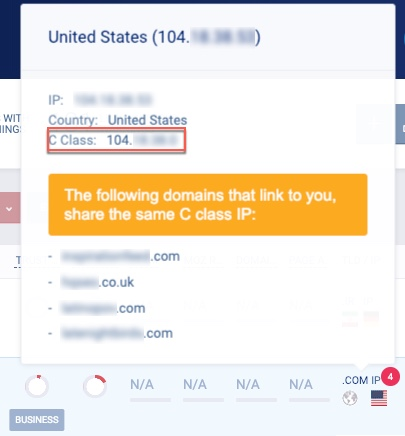
To do a search, find the C Class IP by hovering over a link’s IP data and then type it into the search field:
All the important findings should be included as a summary in the report for your client, along with a separate section of next steps to be taken.
Dive Deeper:
- How – And Why – To Build A Backlink Portfolio
- How to Squeeze the Most Value Out of Nofollow Backlinks from High-Authority Sites
- The Skyscraper Technique: How to Build High-Quality Backlinks to Your Content
Step 6: Prepare a Ranking Report
When preparing a ranking report, mention how many keywords your client’s website is ranking for and how these keywords are performing in terms of engagement. Highlight all the new keywords that you have added or removed in the recent quarter.
You can create a ranking report with a tool like Agency Analytics, which provides ranking reports for Google, Bing, Google Mobile, and Google Local. You can choose the metrics, locations and keywords to track and Agency Analytics will return a detailed keyword ranking report (the best part is that it reports the rankings daily!):
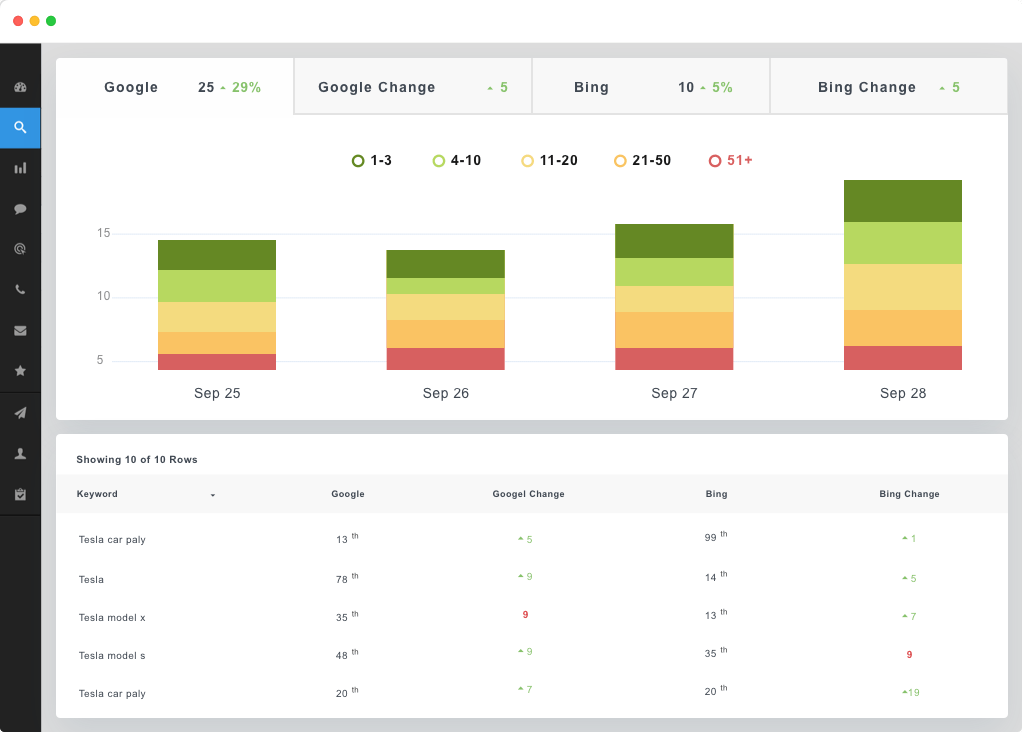
It also enables you to track keywords at the ZIP code, city, state and country level. This is helpful as it reveals what terms people are using to search for your website and from which location. The report includes keyword positions, trends and search volumes. This lets you show your clients the top-performing keywords.
When creating the ranking report with Agency Analytics, you can add your agency’s logo, choose your color scheme, and even create a custom URL for your clients.
Step 7: Prepare a Featured Snippets/Voice Search Report
This is the year that 50% of all searches will be voice searches. Therefore, preparing a voice search report is crucial.
When preparing a voice search report, highlight the keywords for which the client has started ranking for featured snippets, as this will aid in voice SEO.
SEMrush allows you to check how many featured snippets your website already has, and how many new opportunities are present. The Already Featured tab shows the keywords that your site is already ranking for as a featured snippet, and the “Est. traffic gained” metric shows how much traffic your website is generating using featured snippets:
![]()
It also shows how many of your target keywords (that you’ve added to your campaign) have featured snippets. By default, the tab is sorted by the difference in the organic positions between your domain and the URL that is currently featured in the snippet.
This enables you to view the featured snippets you are closest to and for which you have a good chance of getting at the top of the SERPs.
The Lost tab shows the keywords for which the website was in a featured snippet on the first set date but has now been taken over by another domain. You can re-optimize those content pieces to start ranking as a featured snippet again.
Though Google Search Console doesn’t provide any report for voice searches yet, you can still identify voice queries: those queries that are longer, have a conversational tone are in a proper question format. For example, when typing, a user may use a query like “featured snippet,” but when performing a voice search, the user may say “what is a featured snippet?”
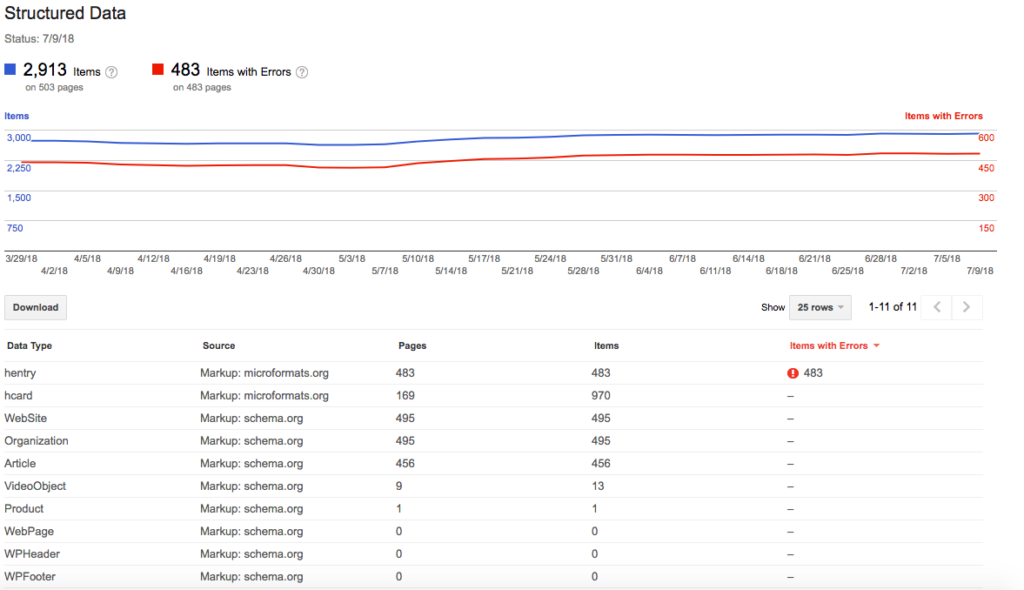
Include schema markup details in your featured snippet report, like how many pages on the site have incorrect schema:
Schema is a semantic vocabulary of tags that enables website owners to embed structured data on their web pages so that search engines can clearly understand, interpret and represent the content in response to a search query.
Getting in the featured snippet not only increases visibility in the SERPs, but can also help improve click-through rates.
You can generate the schema markup report in your Google Search Console. To find the schema markup report, click on Search Appearance > Structured Data. This will allow you to identify and fix errors in your site’s schema:
Highlight the number of keywords that are ranking as featured snippets (track the difference in ranking), the number of new keywords that have just started to rank, the amount of traffic they were able to generate and the impact it had on conversions. You can also mention any new links that you might have acquired due to the page ranking higher in the SERPs as a featured snippet.
Dive Deeper:
- 9 SEO Trends You Can’t Ignore
- SEO & CRO: How Rankings and Conversions Complement Each Other
- VSEO: How Voice Search and Conversational AI Are Changing SEO
Step 8: Prepare a Site Content Report
No matter how great your content strategy is, there’s always room for improvement. A site content report will help you determine what content resonates best with your audience.
When preparing the site content report, highlight the best- and worst-performing content, as well as what you’re doing to improve the performance of the content on the website.
Here are a few things you must include in your site content report:
- Reach
- New visits
- Inbound links
- Social shares
- Comments
- The percentage of repeat customers
- Churn rate
- Conversion rate
- Average read depth
You can use tools like Google Analytics and Buzzsumo to track the metrics mentioned above.
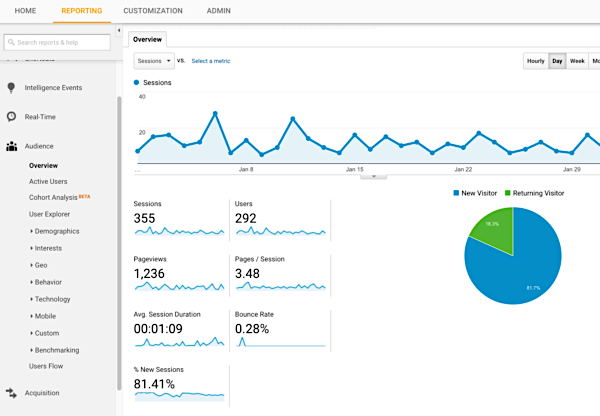
Google Analytics tracks new versus returning visitors, average time on site, conversion rate, bounce rate and other content metrics:
Dive Deeper: Google Analytics for Content Marketing: How to Track and Improve Your ROI
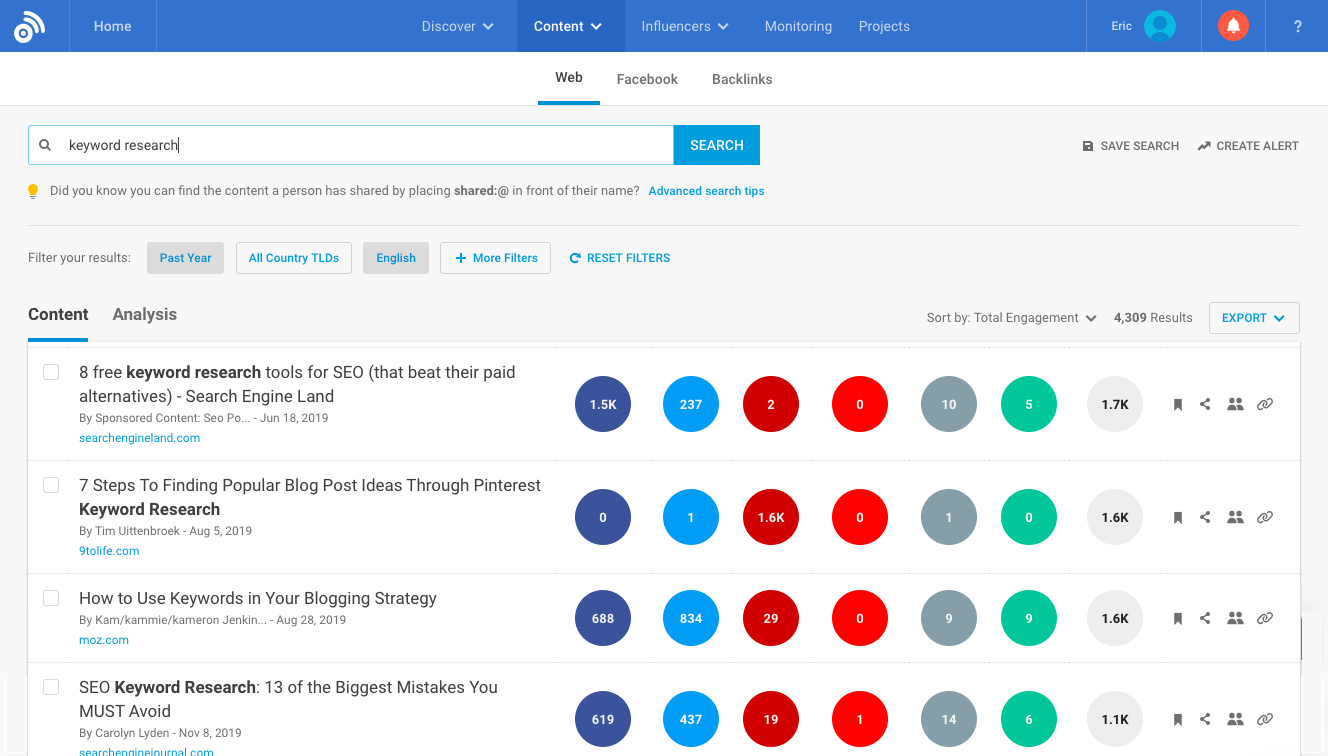
With Buzzsumo, you can see what content is the most shared on which social media channels, including Facebook, LinkedIn and Twitter:
Analyze the E.A.T. (expertise, authority, trust) details in your site report. Content having higher E.A.T. scores have better chances of ranking higher in the SERPs because Google considers them experts in their field. Be sure to check the expertise of the author who created the content, the authority of the webpage and the overall trust of the domain.
Wrapping Up
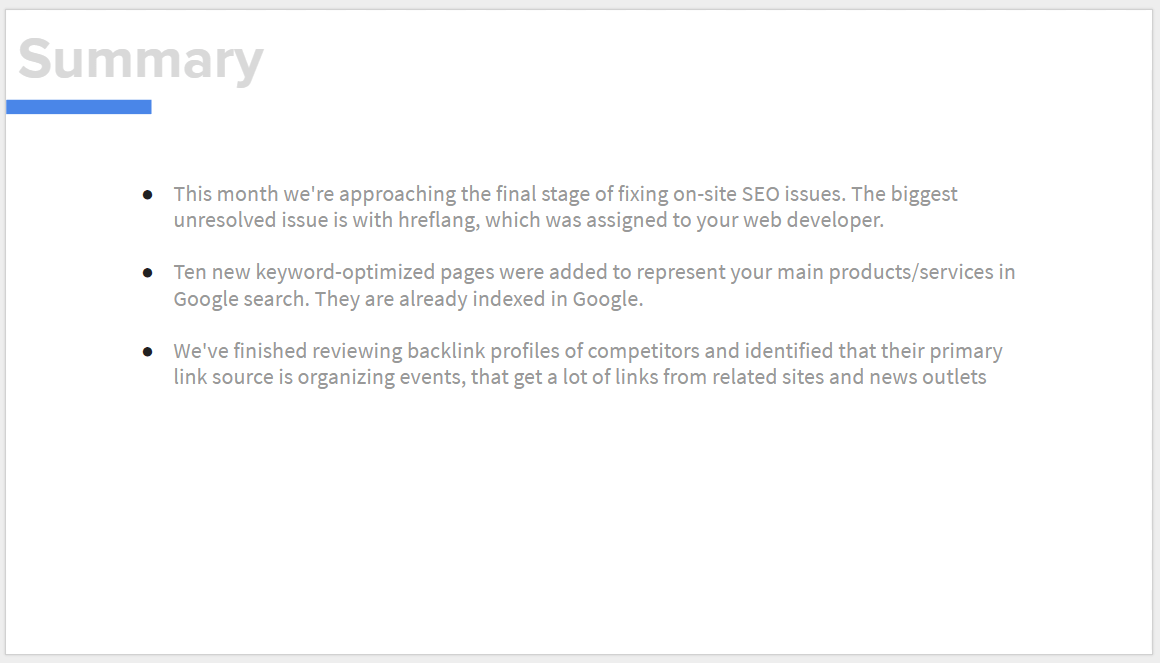
Once you’ve defined your KPIs and compiled all these reports, add a summary and a roadmap to help the client easily understand what you’ve been working on in the last month and what effect it has had on conversions. Your summary can be a detailed outline of everything you did this month (if you feel your client would understand) or just the highlights of your notable wins and major issues:
Remember, a quality SEO report will help you determine the effectiveness of your SEO efforts. First, discuss with your clients what they want to see in the report, and then include a quick blurb for each one using concise language to enable them to understand the metrics in the report. Happy SEO reporting 2020!