Why Infographics Are STILL the Best Content Investment You’ll Ever Make
“Infographics don’t work anymore.”
“There are too many infographics out there. How is anyone going to notice mine?”
“They are too expensive, and we just don’t see the ROI.”
If you or your boss are saying any of these statements, you aren’t wrong.
Like any marketing tactic, the infographic space is now saturated. You can’t just throw a few stats together, add some images and expect the backlinks to magically appear.
That’s why I’m going to show you how you can create infographics that still generate thousands of shares and backlinks.
First, I’ll break down a case study that made infographics popular and then I’ll show you how to leverage it.

TABLE OF CONTENTS:
Infographics Statistics
Before we dive into the “how” of creating a stunning infographic and helping to make it go viral, let’s start with the “why”.
Here are some great statistics that prove infographics are still a great content marketing investment:
- Articles with infographics got 178% more links than standard articles

- 65% of brands use infographics in their content marketing efforts
- Infographics have had the biggest increase in usage among B2B marketers in the last four years — now at 65%.
- 59% of B2C marketers use infographics in their marketing
- Articles featuring infographics received 72% more views than normal articles
- Infographics receive 3x more shares than any other type of content on social media
- Infographics are 30x more likely to be read from top to bottom than blog posts or articles
- When people hear information, they’re likely to remember only 10% of that information three days later. However, if a relevant image is paired with that same information, people retained 65% of the information three days later.
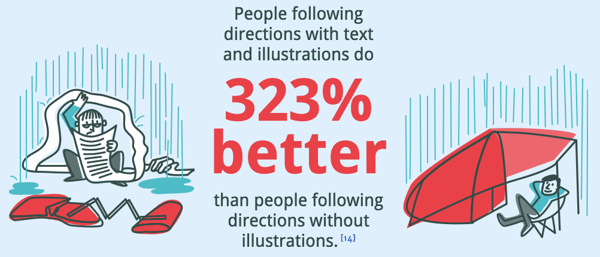
- People following directions with text and illustrations do 323% better than people following directions without illustrations:
Related Infographic Content:
* Top AI Trends in Marketing [Infographic]
* 84 Influencer Marketing Statistics for 2023 [Infographic]
* 7 Ways Influencer + Social Marketing Can Help During COVID-19 [Infographic]
Infographics Case Study
Kissmetrics Infographic
Marketing expert Neil Patel wrote a blog post on Quick Sprout in 2012 called Why Content Marketing Is the New SEO and he broke down stats from Kissmetrics on what happened when he published 40-50 infographics. I’ve seen some pretty great stats in my time, and let me tell you — these stats were crazy!
For example, look at how many times this one Kissmetrics infographic was shared:
Kissmetrics’ backlinks, search traffic and rankings mainly came from those infographics, according to Neil:
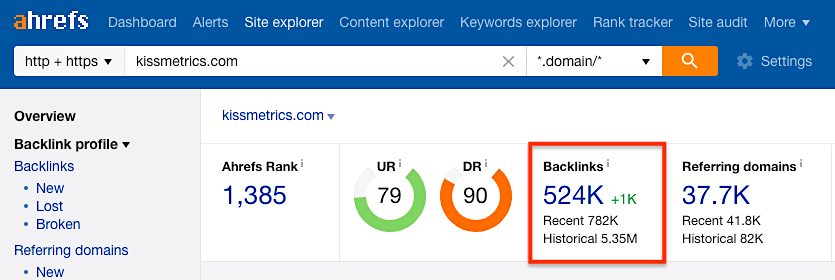
Imagine paying $50 per link (which most decent bloggers charge at minimum). It would have cost so much more to get the same amount of traffic through paid links. The results were pretty conclusive:
Infographics were far and away the best ROI that Kissmetrics ever produced through any form of online marketing.
Digital Marketing Philippines Infographic
Sure, Neil has a lot of brand power and can make just about anything go viral if he really wants to. But, since everyone is trying to leverage infographics, the ROI isn’t as good, right?
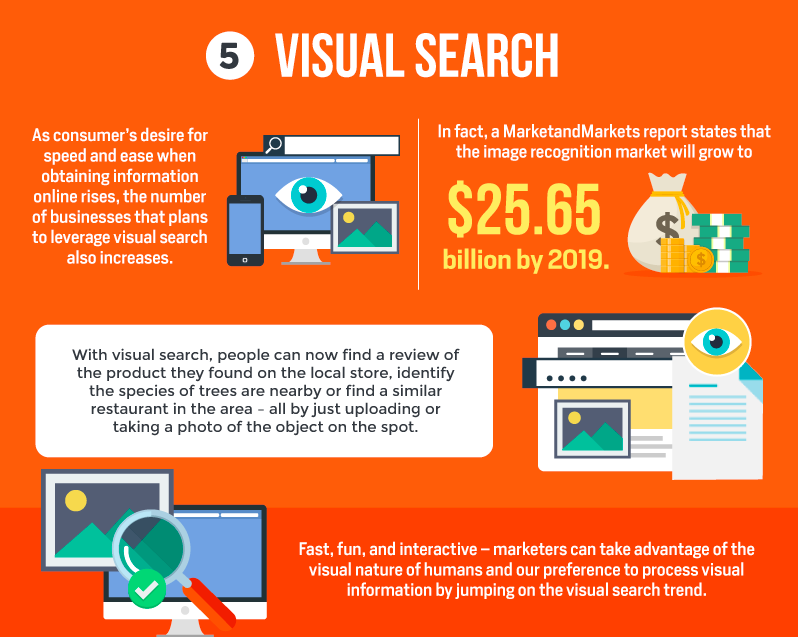
Well, here is an example of an infographic from 2019 that was done by a company called Digital Marketing Philippines, which doesn’t have the same brand power as someone like Neil. It received over 1,600 shares and is both data- and text-rich: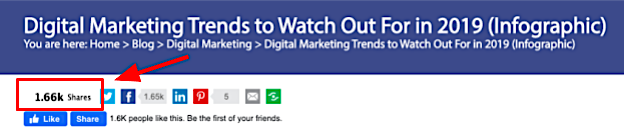
Notice that this infographic also has elaborate design and is much more text rich than some older infographics:
Keep in mind, by the way, that although the marketing industry is saturated with infographics, other industries are still catching on. So if you are in a developing industry, this can provide a huge benefit to you.
Related Content: 12 Types of Interactive Content to Drive Better Engagement
Where Do You Find Great Infographics for Inspiration?
What goes into creating a viral infographic?
Because Neil has sort of pioneered the idea of creating quality infographics, a lot of people have tried to emulate it. Unfortunately, most fall short in the detail and design which ultimately causes the infographic to fail. Since infographics don’t work as well as they used to due to saturation, it is crucial that they are created with rich new data and high-quality design.
1) Visually
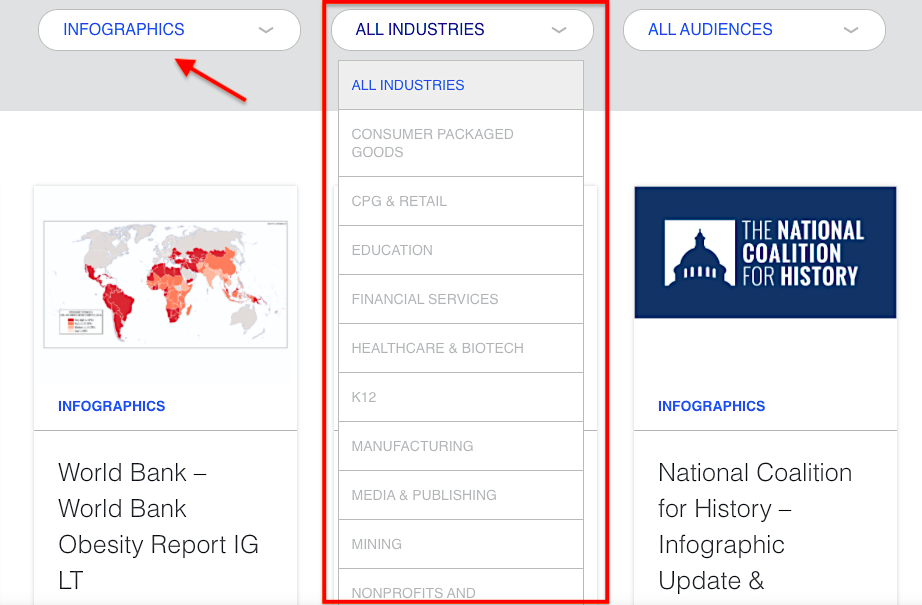
If you want to draw inspiration from great infographics, start at Visually:
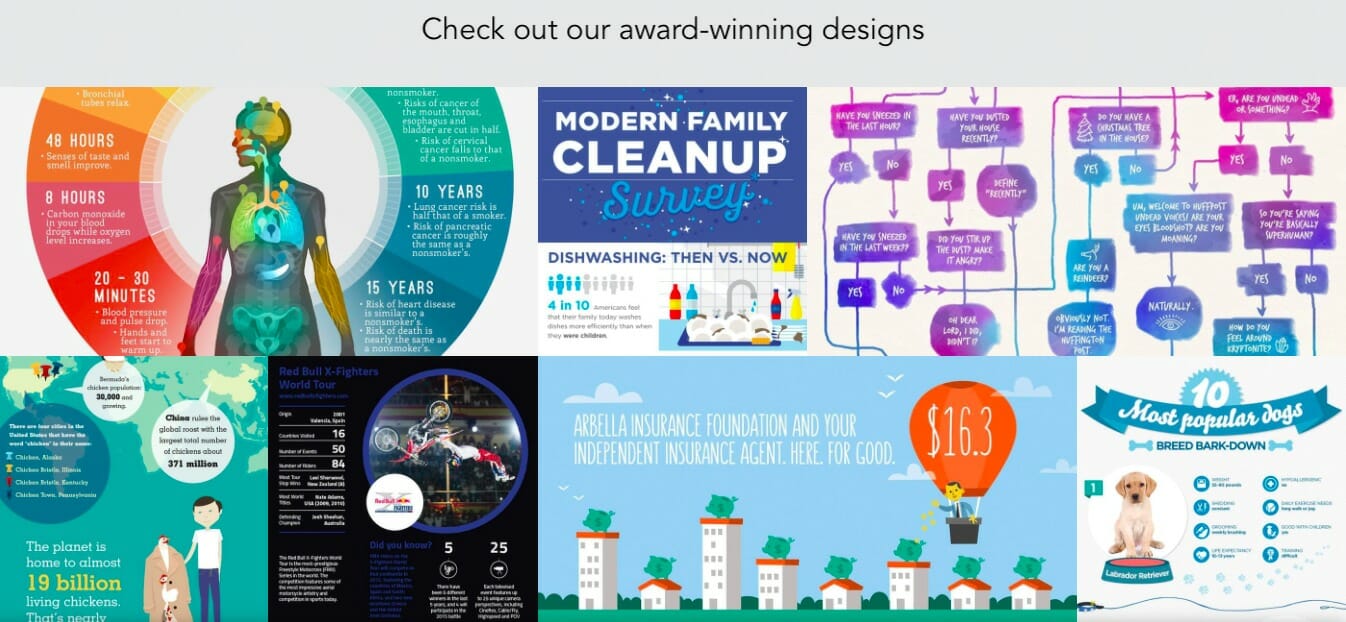
Ask yourself which elements really stick out. Some infographics are just images without real data attached to them, some have poor layouts and others are really hard to digest.
The best part about Visually is that you can sort by industry and audience as well:
2) Dribbble
Check out Dribbble as well:
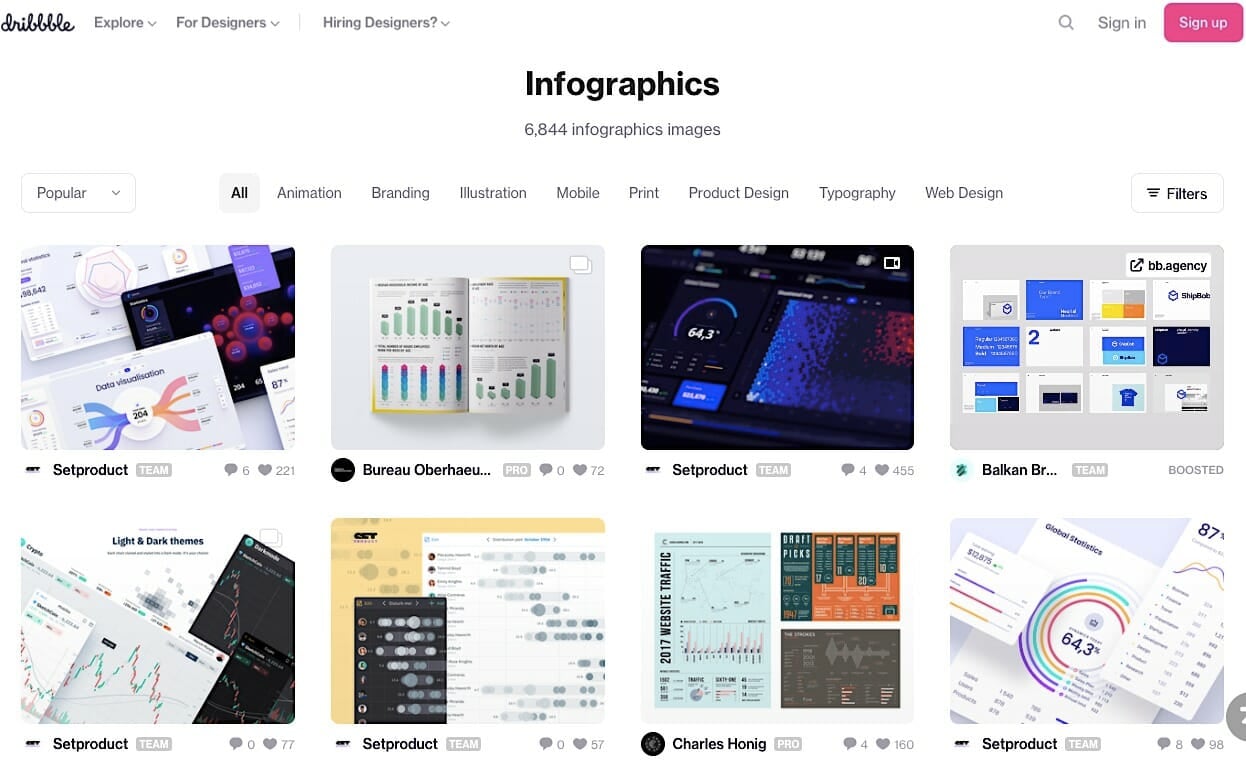
It’s another directory that you can use to search for infographics for inspiration or to hire talent.
You can find good designers on Dribbble for under $1,000. In fact, you can often find great infographic designers in other countries for around $200. If you aren’t sure how to hire designers, check out this Marketing School episode Where Can You Hire Great Designers?
I’ve found great designers on this platform:
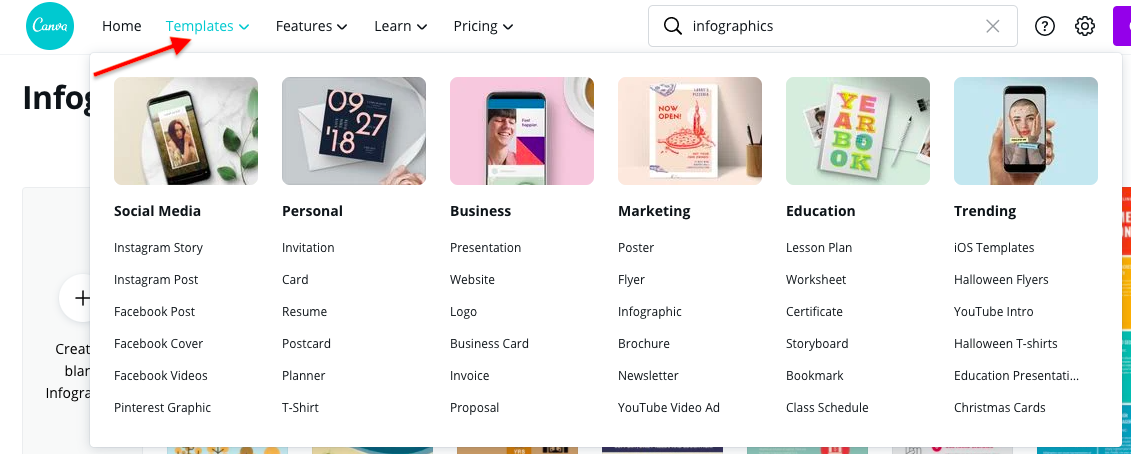
3) Canva
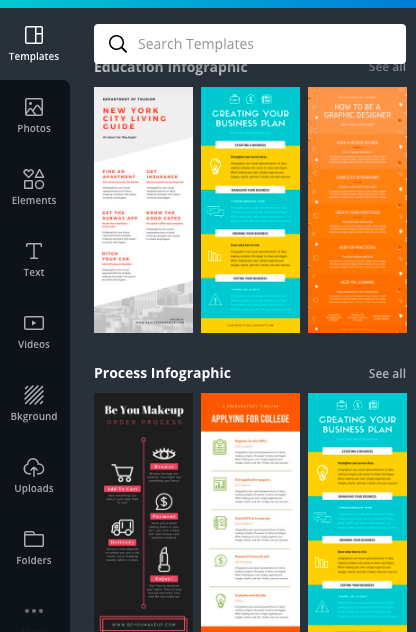
If you are looking for a great solution on a budget, consider using Canva for your infographics:
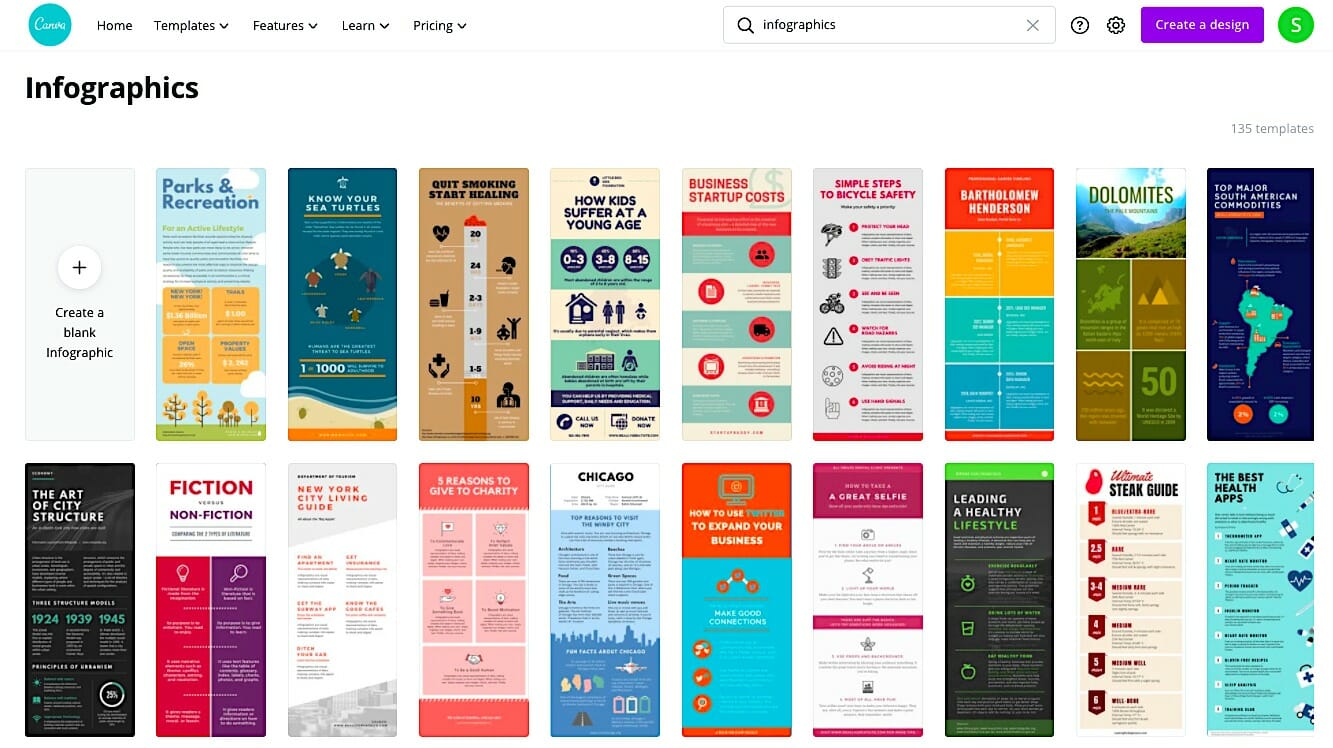
If you don’t have a designer on your team, not to worry! You can easily create an infographic using their beautiful templates:
I use them even just to create images.
The key to success with infographics is to look for the ones that are top-rated and then make a checklist of the successful elements that they share.
For example, this Kissmetrics infographic on color psychology has over 4,300 backlinks!
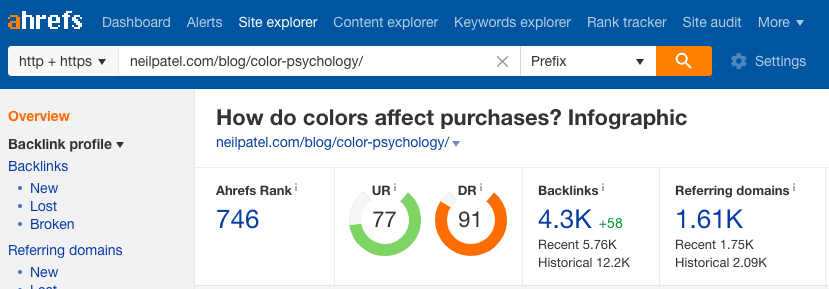
When you look at it, the design of it is very professional, but the content of the infographic is almost purely data:
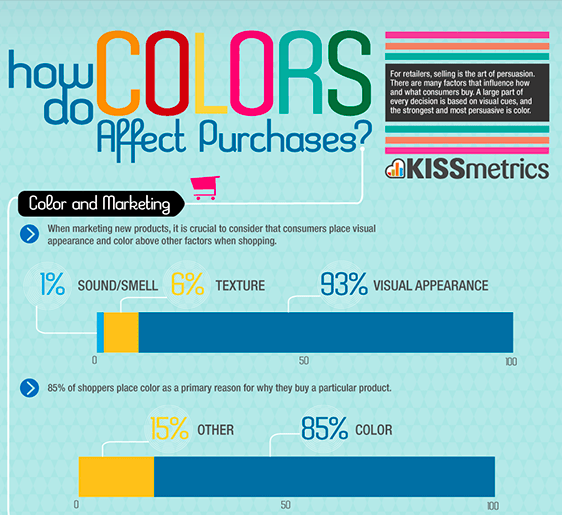
Not only that, but it’s easy to read and is focused on a relatively broad topic. These could be useful stats to CRO experts, content experts and many other marketing professionals.
And don’t just look at great infographics. Look at crappy infographics, too, and then compare the good ones and the bad ones to learn what to do — and what not to do.
Related Content: How To Write Data-Driven Posts
How to Create a Viral-worthy Infographic
The first step to creating a really good infographic is to make sure you have great data. If you don’t have good, complex data that you can simplify, you won’t do well.
Here’s what I usually do:
- Go to Upwork, a large, remote-talent platform for writers, designers, web developers, etc.
- Find a researcher to come up with content or topic ideas for an infographic.
- Have the researcher outline the infographic copy.
- Send it to a designer to create the infographic.
Tips to keep in mind when creating infographics:
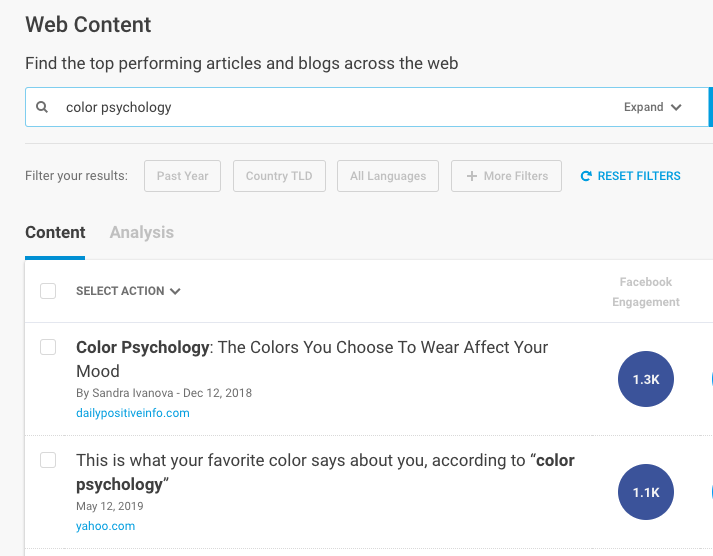
- Research high-traffic topics. Buzzsumo is perfect for keyword research in your industry and to find the most trending pieces for any given keyword (consider reaching out to them to share your infographic that goes along with their data).
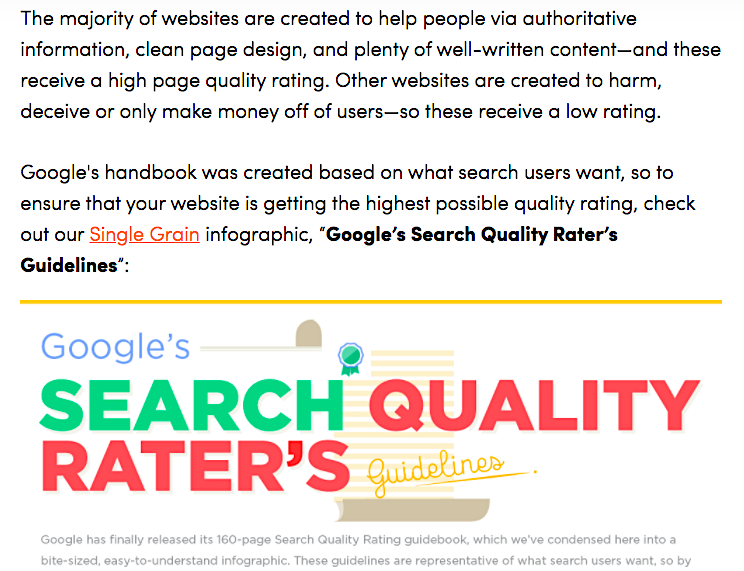
- Add a few-paragraph introduction. Infographics tend to be low on text, which makes them hard for Google to crawl, so add a few keyword-rich paragraphs above your embedded infographic, like this one: Google’s Search Quality Rater’s Guidelines: How to Ensure Your Site Gets a High-Quality Rating! [infographic]
- Don’t have more than six main points. Occasionally you’ll see an infographic that’s about ten yards long, which kind of goes against the purpose of distilling data into an easily consumable visual. Keep your info short and to the point. If your infographic is on how colors affect purchasing, one point could be on the meaning of colors, another on how men perceive colors versus women, one on color and branding, etc.. But make sure that all points flow in a “storyline.”
- Cite all sources. As with any article or blog post, you must cite all references. Generally, these are listed at the bottom of the infographic with the URLs printed out in full. Or, if you’re creating an interactive infographic, you can also embed clickable links within the content copy.

Publish the infographic and give it an embed link. That way, people can easily share it in their own content and you can get backlinks. The embed code generator I use is called WP embed code generator, which creates a copy/paste code like this:

- Allow for comments. Comments will create more text, because infographics don’t have too much text on a page, which can hurt your overall search rankings. The best part is that infographics generate a significant amount of comments. Also, add those social share buttons!
Related Content:
* SEO Keyword Research Made Easy in 2023
* How to Write Lead Nurturing Content: 7 Proven Tactics
* Why Infographics Are STILL the Best Content Investment You’ll Ever Make
Keeping Your Costs Down
On average, your costs for an infographic will be higher than for blog posts.
Back in the day, before decent infographic designers started showing up everywhere, you had fewer options. And then lots of infographic design agencies popped up and were charging anywhere from $5,000 to $20,000 per infographic.
Compare that to what we pay for our high-ranking infographics today: about $100 for research on Upwork, and about $200 for design. That’s a lot better than $20,000 for an infographic!
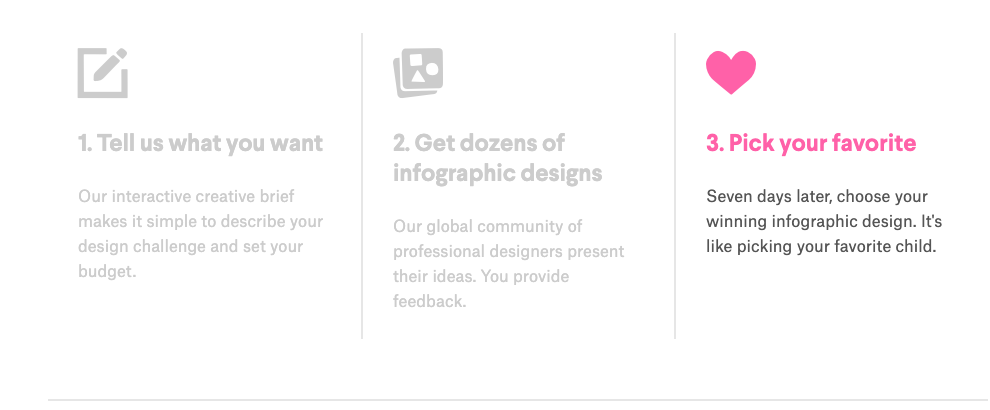
Pat Flynn uses 99designs for his infographics:
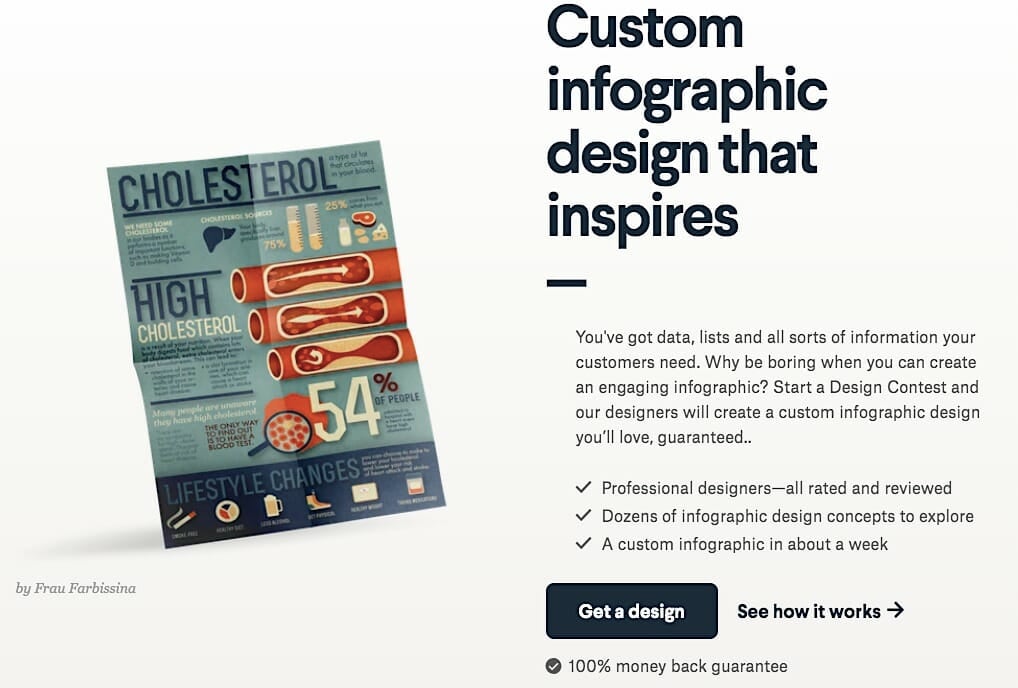
They have a very fast turnaround, you’re presented with more than one design, and you only have to pay for the infographic designer that you choose to work with:
Related Content: The A-to-Z of Viral Marketing (+ Infographic)
How to Make an Infographic Go Viral
The way to make your high-quality infographic go viral is pretty simple:
- Cite your sources and link to those sites.
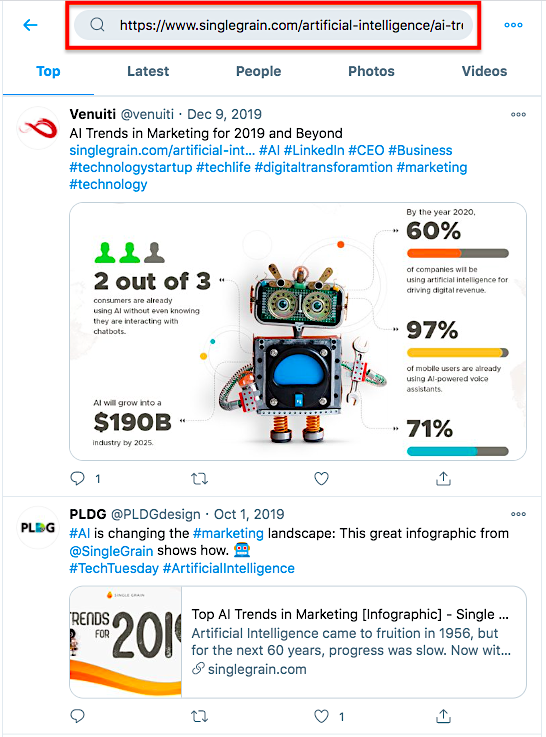
- Find out who shared all those original posts on social media. This is a bit harder to do for Facebook, but for Twitter it’s easy to see every single person who shared it – just paste the URL into the search bar:
- Then take the URLs of those shared articles and put them into Ahrefs, which shows you all the people who linked to those articles in other articles.
- Once you have the final list of all the people who shared your infographic and all the people who linked to it, email or Tweet everyone who shared those articles and ask them to share your infographic. Since they shared the original, and yours is even better, it’s an easy win.
Let’s say Neil shared the original article. I would go find Neil’s email or Twitter handle and say,
“Hey Neil. I know you shared this article on how colors affect purchases. I actually just created an infographic on it, and I think your social media followers would love it. Feel free to share this as well.”
For all the people who linked to the original article, I just use a variation of the same message:
“Hey [name], I noticed that you linked to this article about how colors affect purchases. I actually created an infographic with the same information, plus more. This visual makes it a lot easier to understand how colors affect purchases and which colors you should be using on your website to grow your sales. Feel free to add this link to your blog post if you like it.”
Just by doing these two things, Neil’s Kissmetrics infographics went viral. You don’t even need a popular social media account for your company or personal profile to make an infographic go viral because you can piggyback off bigger profiles with more followers.
How to Maximize Infographic ROI
If it sounds like an infographic is a lot of work and has a long turnaround time, you’re right. That’s why you should always think about repurposing your infographics.
There are a lot of different ways to use infographics as repurposable assets. For instance, you can chop up your infographic to make SlideShares or use them in presentations.
Don’t think that your hundred- or thousand-dollar infographic is just a one-time-use asset.
Consider using the content sprouting method, in which you turn one asset into as many as 13 pieces of content on five separate channels, with your infographics.
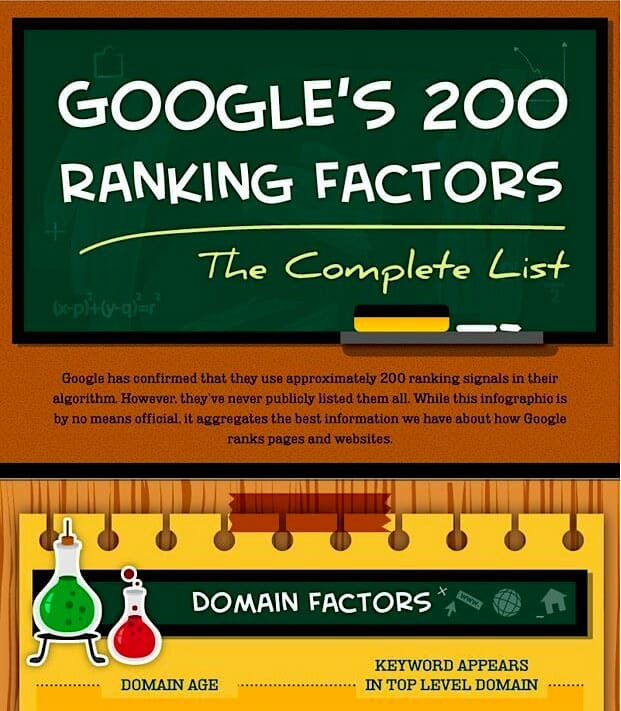
For example, Single Grain created an infographic with Backlinko on Google’s 200 search ranking factors, and after both of them repurposed it, it did very well:
You could also turn your infographic into a YouTube video or you could talk about it in a podcast. The point is that if your infographic does go viral, don’t just sit back contentedly. Take advantage of the virality, and create more content around it.
Related Content:
* 9 Ways to Repurpose Your Old Blog Content
* How to Use Google Keyword Planner for Content Creation
* Omnichannel Marketing: Using the Content Sprout Method to Overcome Info Overload
Takeaway on Infographics
Infographics still work today!
One last case in point:
Shutterstock, an online marketplace for licensing royalty-free images, created an infographic based on its customers’ data about which images they were downloading most often. This one infographic got more than 100 mentions, 6 billion unique site visits, 5,300 social media shares, and more than 11,000 social media engagements.
Remember, the key to a successful infographic is:
- Choose a popular topic
- Analyze various successful infographics in your industry
- Create quality design and content
- Distribute it on all your channels
- Use the Content Sprouting Method to get even more use out of it
After performing these steps, you’ll have a successful infographic, even in 2023 (and beyond!).