ChatGPT Ads Reporting Templates & Best Practices
Clear, actionable reporting is paramount for success in ChatGPT advertising. Whether presenting to executives, clients, or internal teams, a well-structured report with relevant metrics effectively communicates value and informs strategic decisions. This comprehensive guide outlines essential templates and best practices for optimizing your ChatGPT ads reporting.
TABLE OF CONTENTS:
Essential Reporting Elements
Effective reporting begins with a foundation of key elements that provide a holistic view of campaign performance. Understanding and meticulously including these components ensures that your reports are not just data dumps, but powerful tools for strategic decision-making and continuous improvement.
Executive Summary
Every robust report should commence with an executive summary, offering a concise overview of the campaign’s status and key takeaways. This section, ideally placed at the beginning, should be succinct yet informative, providing a high-level snapshot for busy stakeholders. It should include:
- A one-line summary of performance against established goals, clearly indicating whether objectives were met, exceeded, or fell short.
- Highlights of top achievements and significant wins, showcasing successful strategies and positive outcomes.
- Identification of key challenges or areas of concern that impacted performance, along with brief explanations.
- Recommended actions for future optimization, providing clear, actionable steps based on the report’s findings.
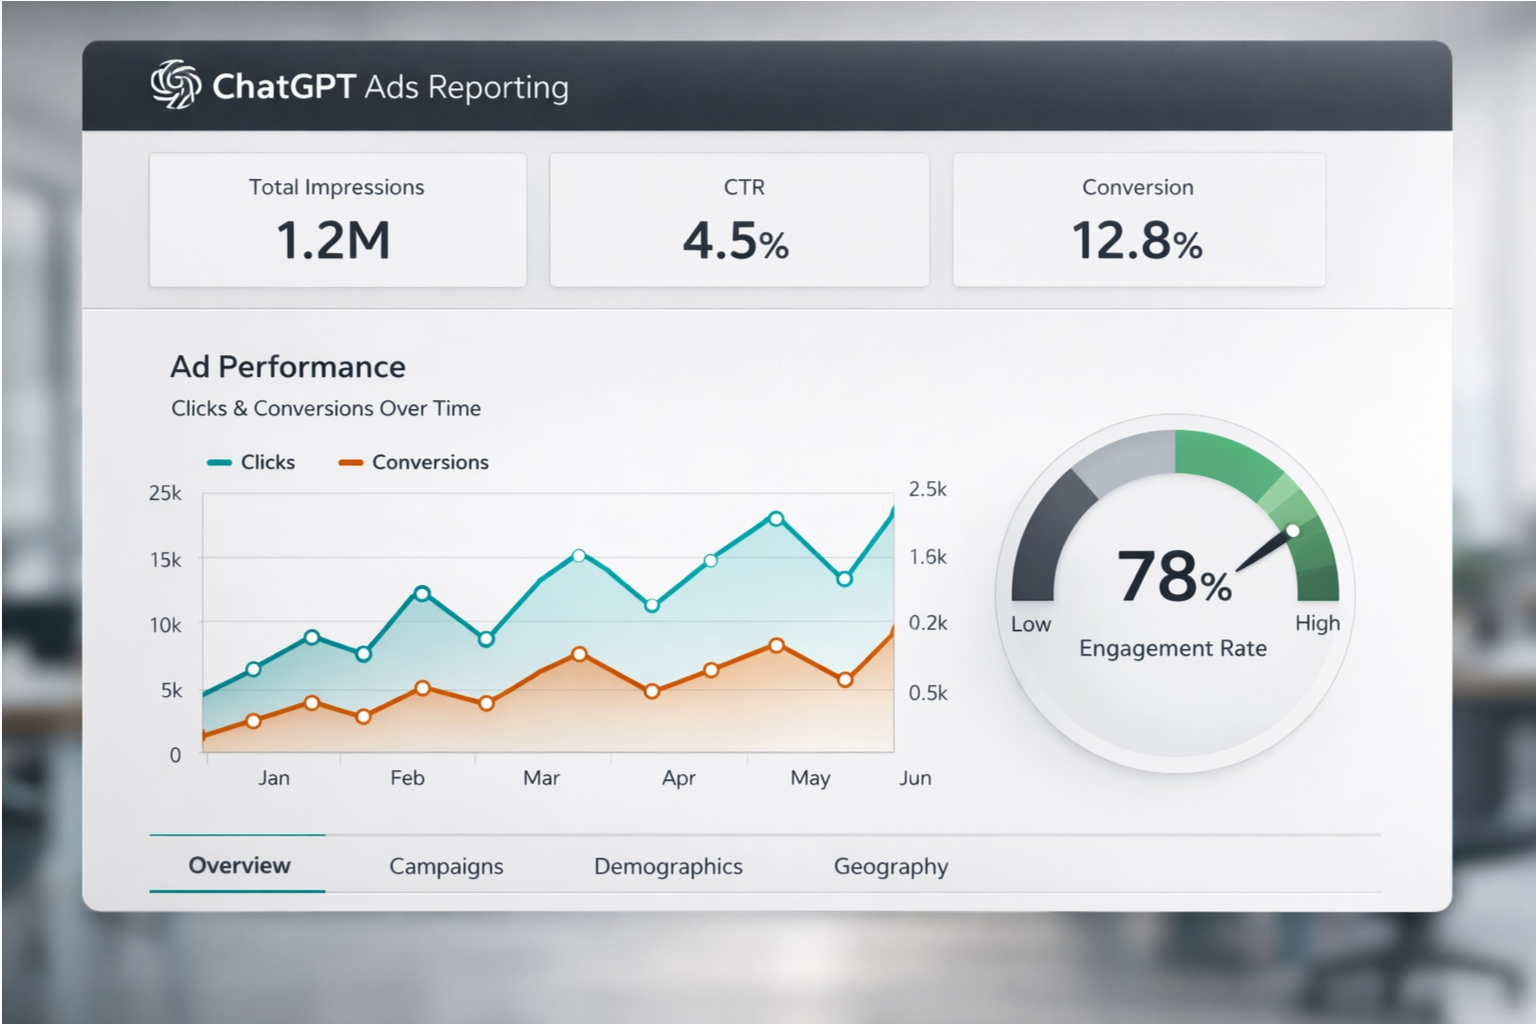
Key Metrics Dashboard
A visual dashboard presenting core metrics at a glance is crucial for quick comprehension. This dashboard should be designed for clarity and immediate impact, allowing stakeholders to grasp essential performance indicators without delving into granular data. A typical dashboard might include:
| Metric | This Period | Last Period | Change | Goal |
|---|---|---|---|---|
| Spend | $ | $ | % | $ |
| Impressions | # | # | % | # |
| Clicks | # | # | % | # |
| CTR | % | % | pts | % |
| Conversions | # | # | % | # |
| CPA | $ | $ | % | $ |
| ROAS | x | x | % | x |
Each metric should be clearly defined, and the change and goal columns provide immediate context for performance evaluation. Learn more about essential advertising metrics.
Trend Analysis
Visual charts illustrating performance over time are invaluable for identifying patterns and understanding campaign trajectory. This analysis should track:
- Daily or weekly performance fluctuations, revealing short-term impacts of optimizations or external events.
- Month-over-month comparisons to assess growth or decline, providing a broader perspective on campaign health.
- Cumulative results to show overall progress and the long-term effectiveness of your ChatGPT advertising efforts.
Segment Analysis
Breaking down performance by key dimensions provides deeper insights into what drives results. This granular analysis helps pinpoint successful strategies and areas needing improvement. Consider segmenting data by:
- Intent categories targeted by your ads, understanding which user queries or conversational contexts yield the best results.
- Variations in ad creative performance, identifying which ad copy, visuals, or calls to action resonate most with the audience.
- Effectiveness of different landing pages, determining which post-click experiences lead to higher conversion rates. Discover best practices for landing page optimization.
- Performance across various audience segments, allowing for tailored messaging and targeting strategies.
Report Templates
Tailoring your report to the audience and reporting frequency ensures maximum impact. These templates offer structured approaches for different reporting needs, ensuring consistency and clarity.
Weekly Report Template
Purpose: To provide a quick pulse check on recent performance and immediate actions. This report is typically concise, focusing on immediate trends and adjustments.
Sections:
- Week Summary: A brief 2-3 sentence overview of the week’s performance, highlighting critical changes.
- Key Metrics Table: A snapshot of essential metrics, often focusing on week-over-week comparisons.
- Notable Changes or Anomalies: Any significant shifts or unexpected results, with a brief explanation of potential causes.
- Actions Taken: A summary of optimizations implemented during the week and their initial impact.
- Next Week’s Priorities: Key focus areas and planned actions for the upcoming week.
Monthly Report Template
Purpose: To offer a comprehensive review of monthly performance and strategic adjustments. This report provides a more in-depth analysis, incorporating broader trends and strategic implications.
Sections:
- Executive Summary: A detailed overview of the month, including overall performance, key achievements, and challenges.
- Performance vs. Goals: An in-depth analysis of how the campaign performed against its objectives, with explanations for variances.
- Key Metrics Dashboard: A comprehensive view of all critical metrics, often including month-over-month and year-over-year comparisons.
- Trend Charts: Visualizations of daily and weekly performance trends, providing historical context.
- Intent Category Analysis: Performance breakdown by ad intent, identifying top-performing categories.
- Creative Performance: Evaluation of ad creative effectiveness, including A/B test results and insights.
- Optimization Actions: A detailed list of all optimizations implemented during the month and their measured impact.
- Next Month Plan: Strategic plan for the upcoming month, outlining objectives, tactics, and anticipated outcomes.
Quarterly Report Template
Purpose: To facilitate a strategic review of long-term performance and future planning. This report is highly strategic, focusing on overarching trends, market positioning, and future growth opportunities.
Sections:
- Executive Summary: A high-level overview of the quarter, summarizing key achievements, challenges, and strategic direction.
- Quarter Performance Overview: A summary of overall performance against quarterly goals and benchmarks.
- Goal Achievement Analysis: Assessment of quarterly goal attainment, with detailed explanations for successes and shortfalls.
- Key Learnings and Insights: Major takeaways and discoveries from the quarter, informing future strategy.
- Competitive Context: Analysis of performance within the competitive landscape, identifying market position and opportunities.
- Strategic Recommendations: Long-term recommendations for campaign improvement, budget allocation, and new initiatives.
- Next Quarter Objectives: Goals and strategies for the next quarter, aligning with overall business objectives.
Best Practices for ChatGPT Ads Reporting
Beyond templates, adhering to best practices ensures your reports are not just data dumps, but powerful tools for decision-making. These practices elevate your reporting from mere data presentation to strategic communication.
Lead with Insights, Not Data
Focus on the narrative behind the numbers. Start by explaining what the data signifies, rather than merely presenting raw figures. Highlight actionable insights and recommendations, connecting metrics directly to business outcomes. For example, instead of just stating a 15% increase in clicks, explain why clicks increased and what that means for the campaign’s success.
Know Your Audience
Tailor your report’s depth and focus to your audience to ensure relevance and impact:
- Executives: Prioritize high-level overviews, business impact, and ROI. They need to understand the strategic implications, not granular details.
- Marketing Teams: Provide tactical details, optimization opportunities, and granular performance data to inform their day-to-day operations.
- Finance: Emphasize ROI, efficiency, and budget management. They are concerned with the financial health and profitability of campaigns.
- Agencies: Deliver comprehensive performance data with clear recommendations and justifications for strategies. Explore how agencies leverage data for client success.
Use Visualization Effectively
Visual aids enhance understanding and engagement, making complex data more accessible:
- Charts: Ideal for illustrating trends over time, such as daily spend or weekly conversions.
- Tables: Best for detailed comparisons of specific data points, like metric performance across different ad creatives.
- Callouts: Use for highlighting key numbers and achievements, drawing immediate attention to critical information.
- Color Coding: Apply to indicate performance against goals, using green for positive and red for negative trends.
Maintain Consistency
Consistency in reporting builds trust and facilitates accurate comparisons. Use the same metric definitions across all reporting periods, maintain consistent formatting, and ensure you are comparing apples to apples. Document your reporting strategy to ensure uniformity, especially when multiple individuals are involved in report generation.
Include Context
Data rarely tells the whole story in isolation. Provide context by:
- Noting external factors that may have influenced performance, such as market trends or competitor activities.
- Referencing competitive dynamics within your industry, explaining how your performance stacks up against competitors.
- Acknowledging seasonality or other cyclical trends that naturally impact advertising performance.
- Explaining any anomalies or unexpected results, providing insights into their causes and implications.
Reporting Automation
Leverage automation to streamline your reporting process and improve efficiency. This not only saves time but also reduces the potential for human error, ensuring accuracy and consistency. This includes:
- Connecting various data sources to your reporting tools, centralizing data for easier analysis.
- Scheduling automated report generation to save time and ensure timely delivery.
- Setting up alert thresholds for critical performance changes, enabling proactive intervention.
- Creating self-updating dashboards for real-time insights, providing immediate access to current performance data.
Recommended tools for reporting automation include Google Data Studio (now Looker Studio), Tableau, PowerBI, and Supermetrics, as well as custom dashboard solutions. Discover more about AI reporting tools for automated analytics.
Master ChatGPT Ads Reporting
Effective reporting is the cornerstone of successful ChatGPT advertising, enabling clear communication of value and driving continuous improvement. By adopting these best practices and utilizing structured templates, stakeholders will gain a profound understanding of performance, fostering informed decisions and sustained investment. For expert assistance in developing robust reporting frameworks that highlight your ChatGPT advertising achievements and optimize budget allocation, consider consulting with specialists in the field.
Frequently Asked Questions About ChatGPT Ads Reporting Templates & Best Practices
Q: What are the most important metrics to include in a ChatGPT ads report? A: Key metrics typically include Spend, Impressions, Clicks, Click-Through Rate (CTR), Conversions, Cost Per Acquisition (CPA), and Return on Ad Spend (ROAS). The specific metrics emphasized may vary based on campaign objectives and audience.
Q: How often should I generate ChatGPT ads reports? A: The frequency of reporting depends on your specific needs and the pace of your campaigns. Weekly reports offer quick pulse checks, monthly reports provide comprehensive reviews, and quarterly reports are ideal for strategic planning and long-term analysis.
Q: What is the best way to present complex data in a ChatGPT ads report? A: Effective data visualization is key. Use charts for trends over time, tables for detailed comparisons, callouts for highlighting critical numbers, and color coding to indicate performance against goals. Always lead with insights rather than just raw data.
Q: Where can I find reliable external resources for ChatGPT ads reporting? A: Reputable sources for AI marketing analytics and reporting tools include industry blogs, marketing technology review sites, and official documentation from platforms like OpenAI. Searching for terms like “AI marketing analytics tools” or “ChatGPT advertising best practices” can yield valuable resources.
Q: How can I ensure my ChatGPT ads reports are actionable? A: To make reports actionable, always include an executive summary with key takeaways, challenges, and recommended actions. Tailor the report to your audience, focusing on insights and business impact rather than just data. Provide context for performance fluctuations and leverage automation for timely insights.
Q: What is the recommended word count for a comprehensive ChatGPT ads reporting article? A: A comprehensive article on ChatGPT ads reporting templates and best practices typically ranges from 1500 to 2500 words, allowing for detailed explanations of concepts, templates, and best practices, while remaining engaging for the reader.
Ready to elevate your ChatGPT advertising strategy? Partner with Single Grain to develop cutting-edge reporting frameworks that drive measurable results and optimize your ad spend. Contact Single Grain today for a free consultation!