Community-Led Growth Metrics That Drive Real Revenue
When 14% of visits to Khoros-powered communities resulted in fewer support cases, you’re looking at more than engagement — you’re seeing direct cost savings and operational efficiency. Yet most growth teams still struggle to connect community initiatives to concrete business outcomes that executives actually care about.
The challenge isn’t building engaged communities, it’s proving they drive measurable growth. In 2025, successful organizations have moved beyond vanity metrics, such as member counts, to track community-led growth metrics that directly correlate with revenue, retention, and reduced acquisition costs.
Key Takeaways
- Focus on business impact over vanity metrics by tracking support cost reduction, customer lifetime value lift, and revenue influenced by community participation rather than just member counts or post volumes.
- Use the four-pillar framework for community-led growth metrics, which includes business impact, engagement quality, responsiveness & support, and growth acceleration metrics that directly correlate with revenue and retention.
- Target 6.8% engagement-per-post rate for excellent performance as top-performing communities achieve exactly double the 3.4% benchmark average, with support deflection rates of 35-45% indicating strong operational efficiency.
- Implement community metrics in phases, starting with KPIs that impact your foundation (support deflection, engagement scoring, CRM integration) in months 1-3, then advancing to predictive analytics and automated health scoring in months 4-8.
- Connect community data to automated business actions by triggering re-engagement campaigns when engagement drops below thresholds and identifying high-engagement, low-adoption members for targeted upselling opportunities.
TABLE OF CONTENTS:
The ROI-Focused Metric Framework
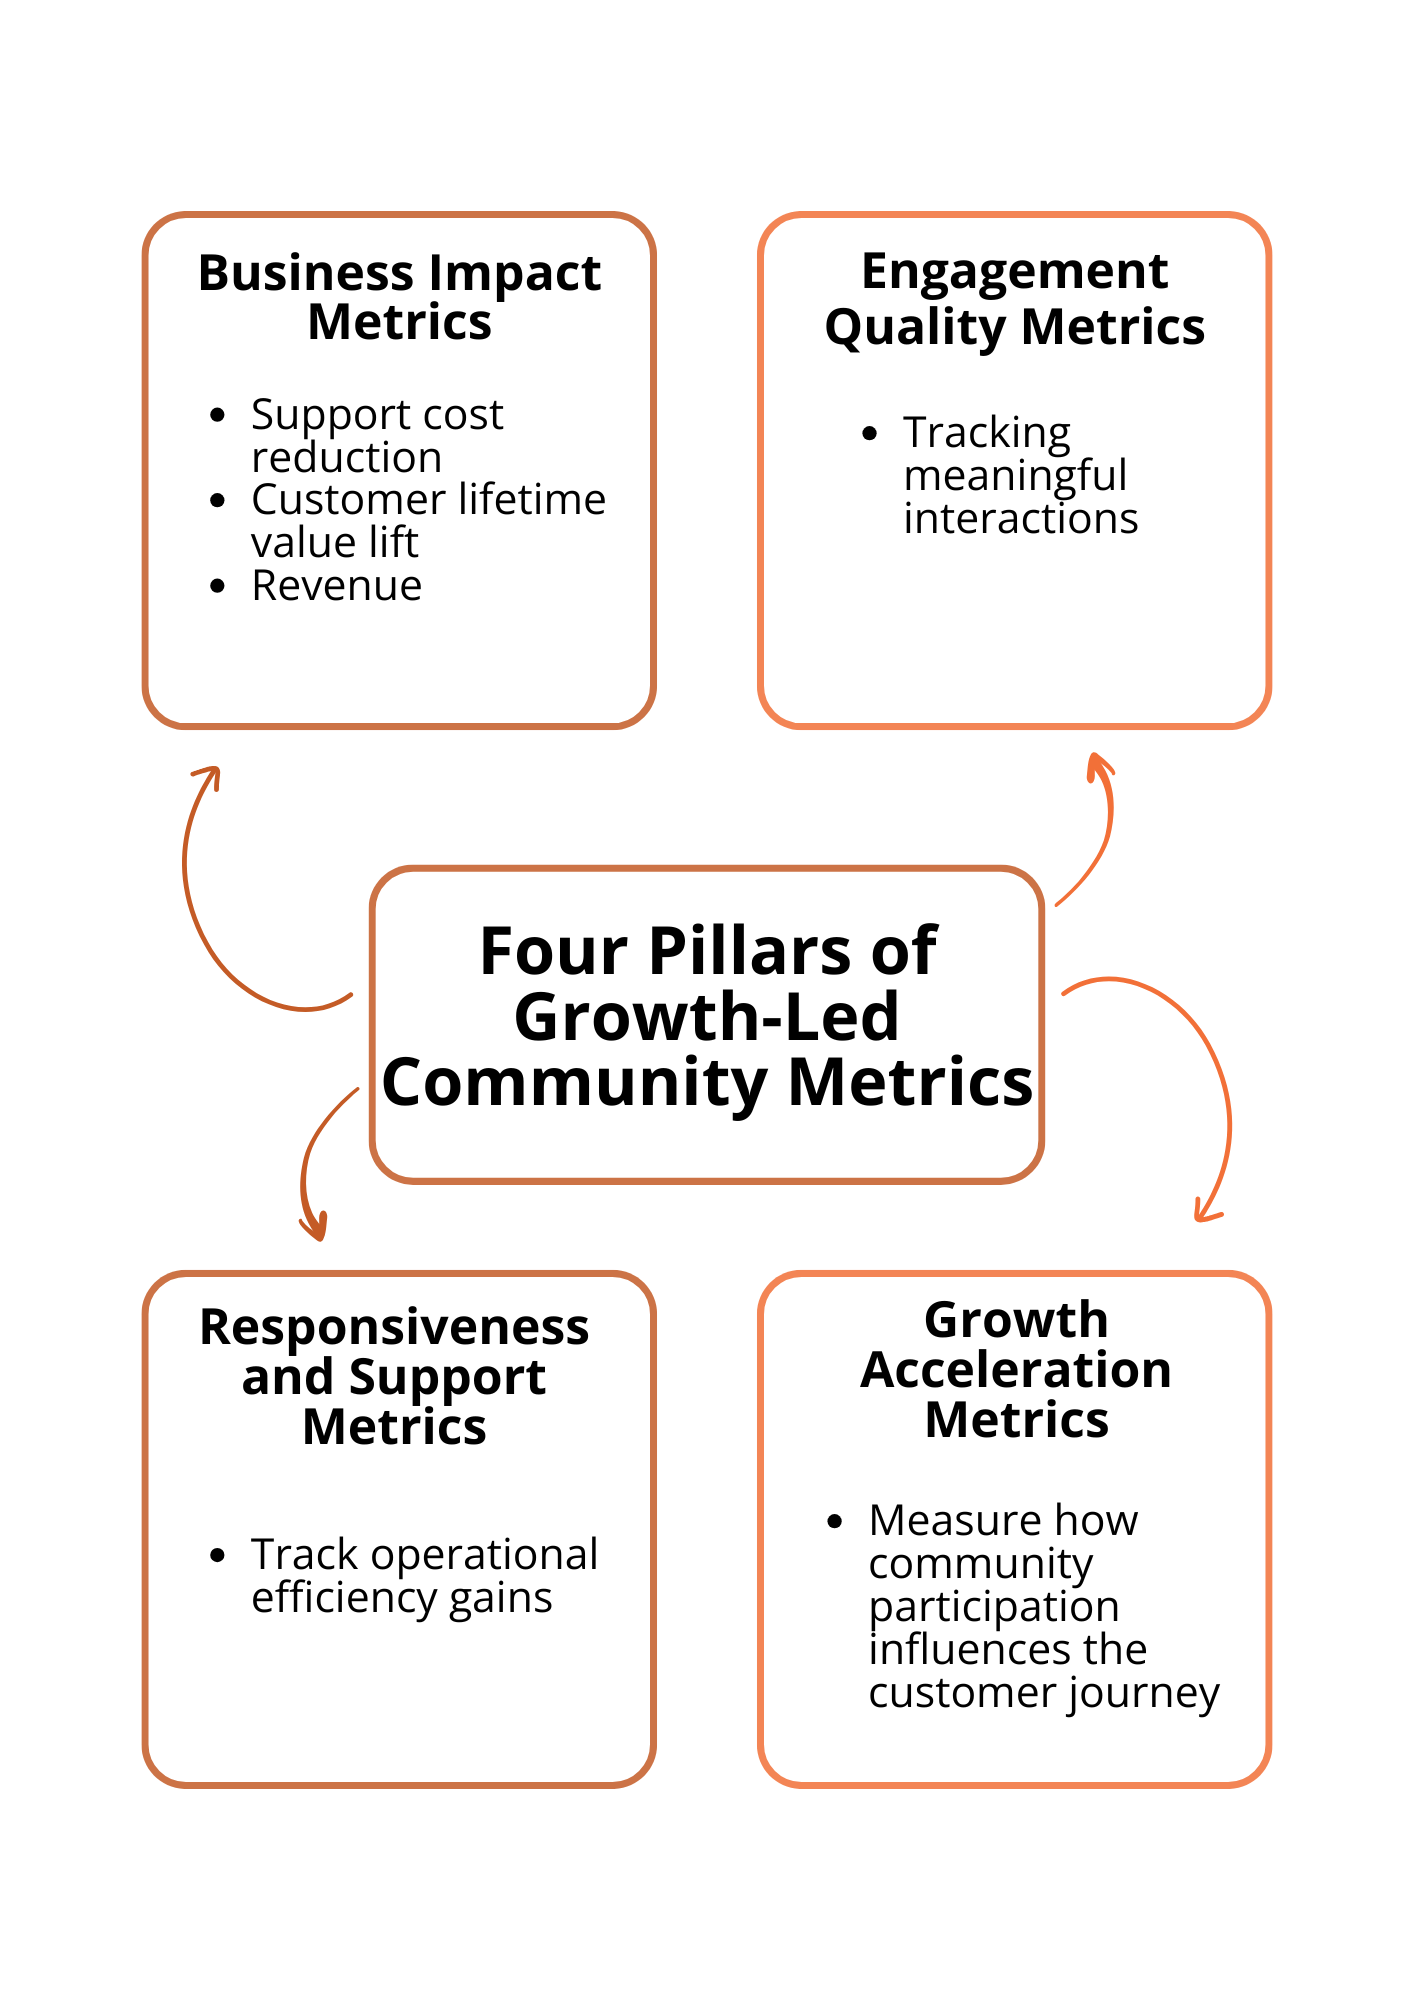
Smart growth teams organize community-led growth metrics into four interconnected pillars that translate directly to business impact. This framework ensures that every metric you track is connected to outcomes that matter to your CFO, not just your community manager. These four pillars include:
- Business impact metrics sit at the center of this framework because they answer the critical question: “Is our community investment paying off?” These include support cost reduction, customer lifetime value lift, and revenue influenced by community participation. When Gainsight customers actively engaged in their community, they recorded 30% higher retention rates and were twice as likely to enter upsell conversations, providing concrete proof of community ROI.
- Engagement quality metrics predict future business impact. Rather than tracking total posts or comments, focus on meaningful interactions. This tactic helped top-performing communities achieve a 6.8% engagement rate per post, exactly double the 3.4% benchmark average in 2025, providing a clear performance target for community teams.
- Responsiveness and support metrics track operational efficiency gains. When Spoonflower achieved a 45% support-ticket reduction rate, they used this as a value driver. Each deflected ticket represented immediate cost savings and improved customer experience.
- Growth acceleration metrics measure how community participation influences the entire customer journey. Data from Common Room’s analysis shows that 72% of community-influenced deals closed within 90 days, compared to 42% for sales- or marketing-led deals, indicating materially faster deal cycles and lower implied customer acquisition costs.
“Communities using a predictive ‘Community Health Index’ report a 31% higher member-retention rate than those without it, demonstrating how data-driven community management directly impacts customer longevity,” HeyOrca Community Benchmark Report 2025
Essential Benchmarks for 2025
Understanding where your community performance stands requires context. These benchmarks, derived from 2025 data, help growth teams set realistic targets and identify opportunities for improvement.
| Metric Category | Good Performance | Excellent Performance | Business Impact |
|---|---|---|---|
| Engagement Rate per Post | 3.4% | 6.8% | Higher engagement correlates with increased retention |
| Support Deflection Rate | 15-25% | 35-45% | Direct cost savings, improved efficiency |
| Member Retention (Annual) | 65-75% | 85%+ | Increased customer lifetime value |
| Community-Influenced Pipeline | 10-20% | 30%+ | Faster deal cycles, lower CAC |
These benchmarks reflect the maturation of community-led growth strategies. Organizations consistently hitting the “excellent” targets typically see community ROI within 12-18 months, while those struggling with “good” performance often require strategic adjustments to their measurement approaches.
Implementation Strategy for Growth Teams
Rolling out effective community-led growth metrics requires a phased approach that aligns with business priorities and objectives. Start by establishing baseline measurements across your four core metric pillars, then layer in advanced tracking as your community matures.
Phase 1: Foundation Metrics (Months 1-3)
- Implement support ticket deflection tracking by tagging community-resolved queries.
- Establish a member engagement scoring system based on the depth of content interaction.
- Connect community user IDs to CRM records for retention analysis.
- Set up basic attribution for community-influenced opportunities.
Phase 2: Predictive Analytics (Months 4-8)
- Use automated member health scoring to identify churn risk
- Compare community-active vs. inactive customers
- Build dashboards connecting community metrics to revenue outcomes
- Establish alert systems for engagement threshold breaches
The most successful implementations integrate community data with existing business intelligence tools rather than measuring individual metrics. This approach ensures that community insights are fed directly into executive dashboards and strategic planning processes.
For organizations tracking content marketing metrics or exploring broader growth measurement frameworks, community-led growth metrics provide complementary insights that enhance overall marketing attribution and ROI analysis.
Turning Community Data Into Growth Decisions
Collecting community-led growth metrics means nothing without actionable insights that drive business decisions. The most effective growth teams use their community data to inform product development, optimize customer success workflows, and accelerate sales cycles.
When community engagement scores drop below benchmark thresholds, high-performing teams automatically trigger re-engagement campaigns or route accounts to customer success for proactive outreach. This automated response system, powered by predictive community analytics, prevents churn before it impacts revenue.
Similarly, identifying community members showing high engagement but low product adoption creates opportunities for targeted upselling or feature education campaigns. These insights transform community platforms from support channels into growth engines that actively contribute to expanding revenue.
Building Sustainable Community-Growth Systems
Community-led strategies do more than boost engagement rates; they make your entire system more efficient, while also increasing sales and reducing costs. To ensure your efforts are successful, businesses should track key community-led growth metrics, including customer lifetime value lift, cost reductions, and revenue growth. This also entails establishing regular reporting rhythms that connect community health metrics to business outcomes, creating feedback loops between community insights and product development, and maintaining executive visibility into how community investments drive measurable growth.
Organizations that achieve the strongest community-driven growth results treat their frameworks as systems that evolve in response to business needs and market conditions. They regularly audit their approaches to fit their objectives, benchmark against industry standards, and adjust their tracking to capture emerging opportunities. Most importantly, they recognize that community-led growth metrics aren’t just about proving past performance; they’re about identifying future opportunities and optimizing systems for sustainable, scalable growth.
Companies interested in measuring KPIs that connect community efforts to business outcomes can collaborate with a leading marketing agency that specializes in data-driven growth strategies across multiple channels.
Ready to stop guessing and start proving your community’s real business impact?
Frequently Asked Questions
-
What are the four pillars of the community-led growth metric framework?
The framework consists of business impact metrics (support cost reduction and customer lifetime value lift), engagement quality metrics (meaningful interactions versus total posts), responsiveness and support metrics (operational efficiency gains), and growth acceleration metrics (community influence on the customer journey). This structure ensures that every metric is connected to outcomes that matter to executives, not just community managers.
-
What engagement rate should I target for my community?
Top-performing communities achieve a 6.8% engagement rate per post, which is exactly double the benchmark average of 3.4%. Achieving this excellent performance target is correlated with higher member retention rates and a stronger business impact from your community initiatives.
-
How should I implement community metrics tracking in my organization?
Start with Phase 1 (months 1-3) by implementing support ticket deflection tracking, member engagement scoring, and CRM integration. Then advance to Phase 2 (months 4-8) with automated health scoring, cohort analysis, and predictive analytics that connect community metrics to revenue outcomes.
-
What support deflection rate indicates strong community performance?
Good performance ranges from 15% to 25% support deflection, while excellent performance achieves 35% to 45%. Each reduced support ticket represents immediate cost savings and improved customer experience, transforming your community into a value driver.
-
How can I turn community data into actionable business decisions?
Utilize automated triggers that launch re-engagement campaigns when engagement levels drop below specified thresholds, and identify high-engagement, low-adoption members for targeted upselling. The most effective teams also route at-risk accounts to customer success based on community health scores to prevent churn.
-
What's the difference between vanity metrics and business impact metrics?
Vanity metrics focus on surface-level successes, like member counts or total posts, that don’t correlate with revenue outcomes. Business impact metrics track support cost reduction, customer lifetime value lift, and community-influenced pipeline that directly affect your bottom line and prove ROI to executives.
-
How long does it take to see ROI from community investments?
Organizations consistently hitting excellent performance benchmarks typically see community ROI within 12-18 months. Those achieving good performance levels often require strategic adjustments to their measurement and engagement approaches to reach profitability targets.