In 1955, Columbia House sold 700,000 records through no more than direct mail marketing and a telephone ordering service. Now, 93% of marketers agree that social media is important for their business.
The business world is changing rapidly, and with it, marketing. Columbia House and other mail-order music services gave way to giants like Sam Goody and F.Y.E., who gave way just a few years later to iTunes. If this trend demonstrates one thing, it’s that modern consumers want a personalized, convenient experience that meets their needs specifically, not the generalized expectations of a homogenized mob.
In the information age, data is changing the game. Marketers of both large and small businesses here the term “Big Data” all the time, but what does it mean to their business? Rest assured, data is becoming a necessity for all marketers, particularly inbound marketers, and the insights provided are profound, important, and readily available to those who know where to look.
The Need for Data
It’s a growing discussion: data and its place in business. For decades, business has been a speculative venture, to a degree. Ad campaigns possessed no direct tracking mechanisms. Collecting customer demographic and lifestyle information required low-response-rate telephone efforts and manual data collection.
Even when data was available, the mechanisms for examining, comparing, and utilizing that information was sparse; the technology simply did not exist to make the process worthwhile. Larger companies had the resources to scrape data from their customer base, but small businesses in particular were forced to operate in an ecosystem that was, by today’s standards, opaque.
Flash forward, past the birth of the personal computer and the construction of vast and powerful computer networks: the game has changed. Massive data collection efforts and equally massive computational capabilities have made the analysis and understanding of customer behavior, marketing effectiveness, and business strategy available to enterprises large and small.
This alone is enough to merit the need for data. Whenever technology opens the door for better products and service, businesses must walk through it. However, this motivation alone pails in comparison to the rising expectations of customer in an increasingly enabled environment. 25% of consumers who complain to a company on social media expect a response within 1 hour. Emails triggered by specific customer behaviors yield 71% higher open rate and 102% higher click rates than non-triggered, boiler-plate email messages.
These statistics paint a simple picture: modern customers require more responsive and personalized service through channels with which they are comfortable. Long hold times on customer service lines are no longer acceptable. Mass mailings and copy/paste marketing are no longer converting when audience segmentation offers the kind of small-business service that customers have grown to expect.
Data collection and analysis, particularly in volumes enabled by the Internet, provides greater insight into customer lives, preferences, and desires. In addition, it offers greater insight into the efficacy of business practices and strategy, and provides concrete, actionable information on which to base important decisions in a myriad of business contexts.
The Basics
Digital marketing is fortunate enough to fall within a medium that facilitates the practice of analytics. Whether it’s email campaigns, coupon codes, or just web visits, there are dozens of opportunities for even small enterprises to utilize data.
The most fundamental building block of any business in the modern media ecosystem is the website. Customers no longer use corporate websites just for contact information, but for product inquiries, conversations with other users, and even consumption of relevant content. In this way, the corporate website has become one of the most valuable digital marketing tools, delivering engagement and information in exchange for insight and data.
“Big Data” often evokes the image of large, complex campaigns requiring sophisticated analysis. However, data collection is much simpler than this.
Forums and Comments
Company blogs are quickly becoming a staple of businesses as part of a content marketing strategy that’s connecting customers and opening businesses to new opportunities. Even without an analytics plugin installed, blogs provide fruitful ground for better audience understanding. Is your audience responding negatively to your content? Is your audience responding to your content at all? What concepts or ideas are frequently mentioned in blog discussions? Each of these offers a chance to analyze and better understand your customers’ needs.
This is just one example, and there are many other, creative ways to collect data about your customers. Did your blog posts see any sharing on social networks? What can you learn from a video campaign that encourages your customers to create their own video responses? Each of these avenues provides data and insight in a way that was not possible just a few short years ago.
Google Analytics
Of the available options, however, few options provide insight like Google Analytics. By far the most frequently used platform for data collection on web properties, Analytics offers a host of tools that can help novices and experts alike understand and reach their target demographics.
If you’ve never used the platform before, the information provided can be overwhelming. Fortunately, for sites just getting started, or older sites looking for some surface-level evaluation of their strategy and customer needs, there are some basic metrics that can provide guidance.
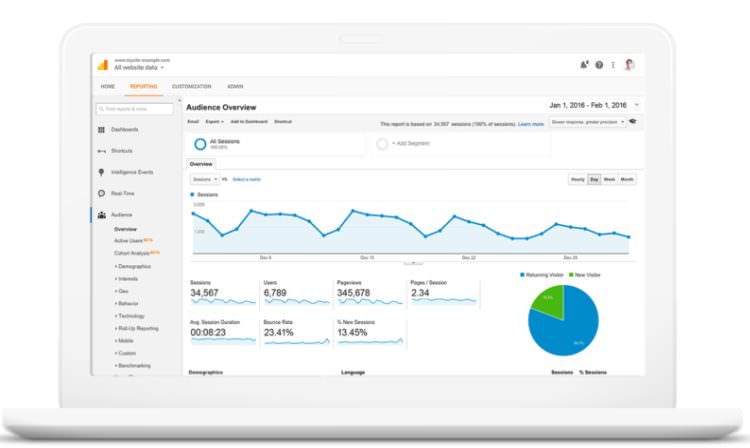
Dashboard Metrics
When you first sign in to the application, you are presented with a “dashboard”. This dashboard displays several statistics about your site designed to provide an at-a-glance look at your performance.
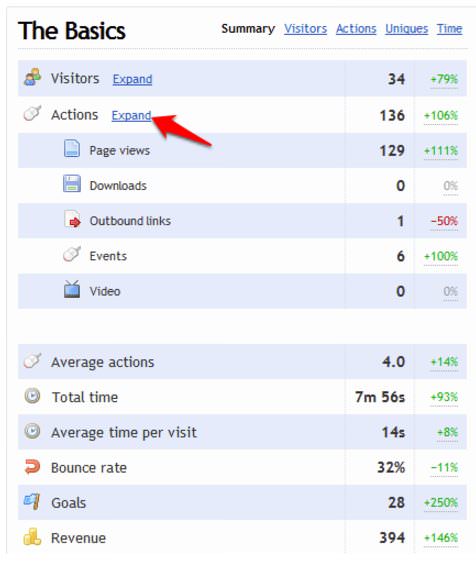
Of these statistics, three items should be noted: pages per visit, average visit duration, and bounce rate. Pages per visit is a look at how many pages the average visitor viewed before exiting your site. A high number suggests that they found your product or content interesting and stuck around. The average visit duration indicates what amount of time was spent on the site. A low number suggests that viewers scrolled through the available content and then left. The bounce rate indicates the percentage of visitors that viewed a single page and then left. A high bounce percentage suggests that users viewed only a single piece of content, were not compelled to view further, and left the site.
Each of these has its place, and understanding them involves understanding how users interact with your site, a concept that we will discuss later.
Most Viewed Pages
When you’re looking to nail down the content that converts, most viewed pages is the metric to watch. When you’re first getting started with blogging, it is not uncommon for one or more posts to “miss the mark” so to speak. Your most viewed pages give you insight into the topics that resonate with your viewers, offering helpful direction in future brainstorming.
Most Exited Pages
The most exited pages tells you which pages prompted departure from your site. This information is not only useful in determining which pages failed to convert potential buyers, it can also help indicate pages with technical problems. Take note: an exit rate of over 80% on a single page is significant, and should be investigated, both from a technical and conceptual standpoint.
Referring Sites
Rarely will you find that a majority of your users are finding your site by typing in the URL directly. Most sites rely on referral traffic, or links from other websites.
Understanding who is sending users your way is vital to establishing a link-building relationship with them. If a blog is frequently citing your business blog for helpful information, your statistics will show this, and your content marketing will benefit from some cooperation.

Advanced Analytics
Each of these metrics can provide information that’s vital to improving your marketing efforts. Site traffic, exited pages, and bounce rate all help indicate whether your team is nailing your content marketing strategy. With this kind of information, developing better blog engagement strategies and lead-generating content becomes a process of reading and understanding user behavior.
The problem with these metrics in isolation of one another is that they fail to paint a complete picture of user behavior. Customers require customization, and understanding their lifestyles, goals, and aspirations in a meaningful way is tantamount to success. Our visitors are coming to the site, but why? We’re getting a lot of links from joesblog.com, but how engaged are those visitors?
Understanding User Behavior
As you can probably see, user behavior is not a simple concept. This is not only because users are, at their core, individuals with often divergent reasons for visiting, returning, purchasing, or exiting, but because the way that behavior manifests online is not always clear at a glance.
Consider a hypothetical user named Jane Doe. Jane leaves for work every morning at 7:30 AM, but likes to check up on the news before she departs. Because she has limited time, she saves these links in a reading program called Pocket and then catches up with them later. Part way through the day, she decides to do some online window shopping over lunch. She adds some items to her cart, but has to close the web page when she realizes that she has a meeting in just a few minutes. She returns home later that night, reads her articles, forgets about her potential purchase, and falls asleep to some Zeppelin.
To a human, these actions make sense. To a computer, they make far less sense. Jane’s quick visit to several web pages early in the morning registers an average visit time that is very low which, to the untrained eye, would suggest that the content therein was not engaging. Her abandoned cart in the middle of the day looks like a failed conversion to the analytics software, while a human understands that it was a simple mistake of timing. What does the link look like in Pocket? Does it register as a visit? What does the source look like?
The Importance of Context
Each of these interactions, observed in isolation, lend some pretty misleading insight to the untrained viewer. A more seasoned marketer might look at her sessions, and notice that she is a returning user who has made several purchases in the past two months. In addition, she has left several comments on the company blog, despite her seemingly brief visits to the site itself.
In truth, there is no one-size-fits-all combination of metrics that, when observed in tandem across all industries, indicates success. Savvy marketers understand that user behavior is individualized, segmented based on persona and product, and manifest in often irregular ways. What matters is that your team knows your audience, can track and empathize with their journey throughout the buying cycle, and develop strategies and analytical goals that indicate fulfillment of their needs.
Metrics to Consider
While there is no catch-all package of metrics to monitor, there are some more nuanced analytics that provide valuable insight.
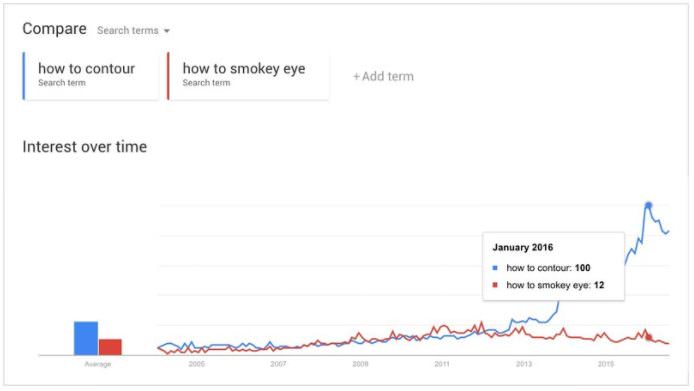
Organic Search Traffic
While direct and referral traffic are helpful, organic search traffic remains one of the most potent avenues for traffic generation. In fact, in a head-to-head matchup between organic search results and paid traffic, organic search results land the user 94% of the time.
Google Analytics provides information regarding keywords that lead to your site. Look specifically to build non-branded keyword volume; an indication that traffic is generated through relevant content and a perception of trustworthiness. Doing so will generate more traffic in the long-run, and help facilitate link-building and future direct traffic.
Top Landing Pages
Users don’t just magically find information on your website. Often times they must traverse a series of web pages, beginning first with your landing pages. This metric looks at what pages are greeting your customers. These pages should be optimized, both in terms of load time and copy, to quickly and seamlessly engage readers and lead them to further browsing or sales conversion.
Segmentation
When customization is expected, buyers can no longer be lumped into one broad category. Google Analytics allows for the filtering and analysis of user behavior based on characteristics, traffic source, and keyword search, among many other criteria.
Using each of these requires understanding of their use on a case-by-case basis, but suffice to say that user behavior depends on more than just your copy. Understand your audience’s intentions, goals, and referring source, and you can better understand their subsequent behavior. Doing so can help facilitate better marketing and targeting for current and future campaigns.
Putting It all Together
As we’ve described already, user behavior manifests online through a combination of statistics. For site owners looking to understand these statistics in conjunction, manually checking each one individually can become a chore. Fortunately, Google Analytics carries the capability to look at the fulfillment of multiple metrics at once through “goals”.
Site goals are as individual as businesses themselves. A business looking to build a contact list for in-person sales calls will obviously have differing goals from an eCommerce site. No matter the specific needs of the entity itself, Analytics provides a platform that is both versatile and customizable.
If you’re an individual with a blog or a small business doing content marketing through a blog, Google Analytics is the perfect tool for you.
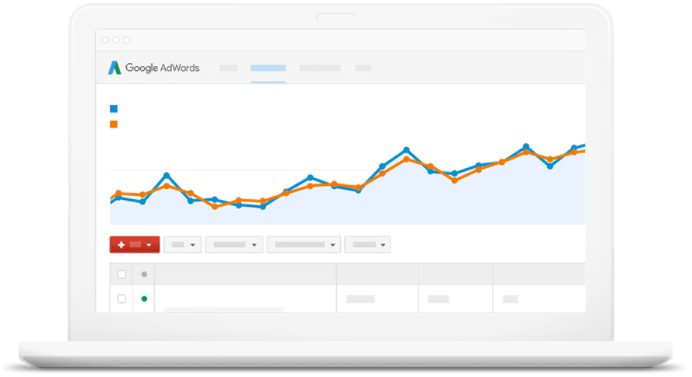
Its free, it has AdSense and AdWords, search console, and also advanced analytics with segmentation, and real-time data. But if you’re a bigger enterprise that can afford to pay few bucks for big numbers then Google Analytics 360 might be a good investment.
Apart from the capabilities of free Google Analytics, Analytics 360 provides includes some more features.
Following are some of the additional metrics that Google Analytics 360 provides:
- Data freshness – Data freshness is how long it takes Google Analytics to collect and process a hit from your property, and then make the data available via the Analytics interface or API. With this feature, you can make changes to the site and instantly check how user behavior is affected. How soon this data is updated depends on the report you’re trying to generate. I’ll talk about an alternative tool later, that updates data to the minute.
- Custom Funnels – This metric helps you determine the click through rate, bounce rate and goal conversion rate. This is nothing but a method to determine if your customers are successfully completing a task they started on your site. Are they adding items to the cart after browsing through the products? Are they buying the items in the shopping cart or abandoning it? In few steps you can configure custom funnels with filters, stages.
Here’s an example of a custom funnel :
‘You have defined a Custom Funnel consisting of 2 stages: Page A and Page B. With the At any time after a stage option selected, a user who visited Page A, then Page X, then Page B would be counted as completing both stages of the funnel.’
You can find more examples on custom funnels here and steps to configure them.
Google Analytics also provides integration with Google Big Query. Big Query is ‘a fast, economical and fully-managed enterprise data warehouse for large-scale data analytics’
It is serverless. but you can also scale your database from gigabytes to petabytes in minutes. Data is all in the cloud so you don’t have to burden yourself with duties of administration or security.
Here’s a quick comparison of these two tools for you to decide what’s best for your site
This comparison simply conveys that Google analytics is for smaller companies and individuals whereas Google analytics 360 is for bigger enterprises.
Here are some more metrics that you can cipher off analytics –
- Improve SERPs: Find the pages that have low ranking based on keywords. You can then change your content on these pages that’ll raise ranking eventually.
- Traffic to site: Will help you find the sources that drive traffic to your website.
- Bounce rates: When you have high bounce rates you will know exactly where exactly to create lead magnets so user doesn’t leave the website.
- Click through rates: With measurable click through rates and user age group on Google Ads on your page, you can determine the appropriate Ads to display to attract the ideal customer. This is the best way to know what your customers love.
Here’s more Google analytics tools to help you give consumer insights.
Now let’s talk about some alternatives. Why alternatives you ask? Because believe it or not, Google Analytics has some downsides in certain features. Depending on what you’re trying to infer from your analytics data you can pick and choose from other free and paid services accordingly.
This way you can get best of both tools by integrating the two.
Some alternatives to Google analytics are : Pikwik, Parsel.ly, Clicky, KISSmetrics.
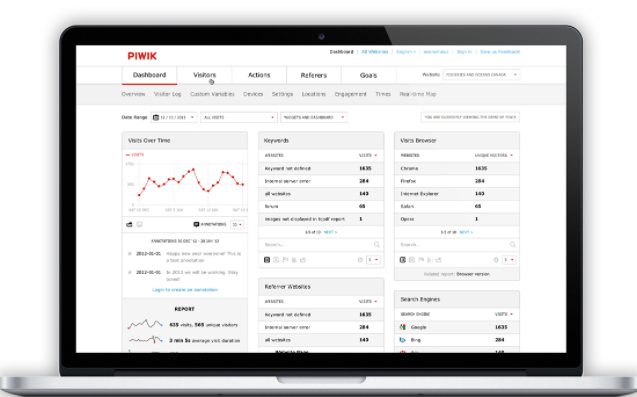
Pikwik – If you’re a privacy minded person or company, in other words are picky about where your data resides then Pikwik is the tool for you. You will have the convenience of hosting all data on your own servers which is a preference in European countries with stricter information policies.
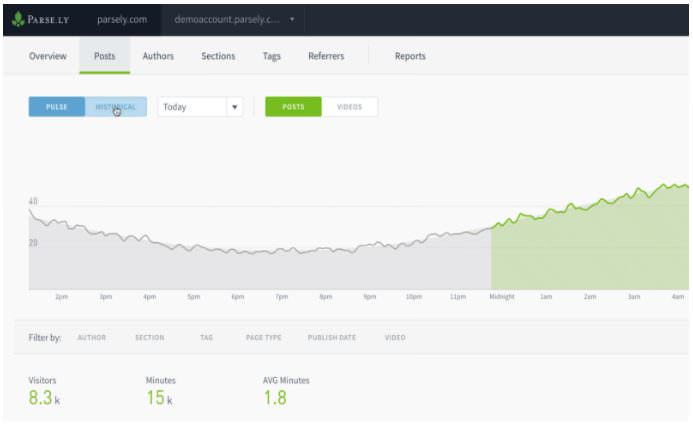
Parse.ly – Google Analytics doesn’t provide real time data in reports. Whereas Parse.ly gives accurate real-time data.
Clicky – If you want a simple to use interface up and running in minutes without a learning curve like Google analytics then Clicky is right for you. All data you view is in real time i.e. updated right to the minute. All reports are extremely detailed, and records every action of all visitors on your website.
If you have encountered and annoyed by the generated spammy visitors in Google analytics then Clicky is very good at blocking such malicious bots and spam.
KISSmetrics – This tools is a slightly a pricier option starting at $200/month. But if your goal is to convert more visitors to clients, that’s not a bad deal to make more sales. KISSmetrics does this by studying customers through behavior-based emails. These emails engage with customers at every step until they convert them to client. They actually call their analytics program – ‘behavior analytics platform’. This says it all.
“Big Data” and the Future
As complex as these ideas may sound, site analytics only scratches the surface of what Big Data can attain. Before you invest in large scale networks or widespread data collection, however, begin with the basics.
You have all this data but what do you infer from it?
You or an expert needs to convert this data into stories. That’s why you need data experts to interpret data and measure key metrics. If you are a big enterprise with terrabytes to petabytes of data, it won’t hurt to hire a data expert to decipher invaluable customer insights.
It’s the people behind the metrics that play a significant role in accurate measurement.
All in all, any analytics tool should help you find your ideal customer so that you know you’re posting the right content to appeal the ideal customer.
Use Google Analytics to understand your audience and apply those insights to your marketing campaigns. Examine user behavior and strive to understand your buyer’s individual journey. Segment your audience into individual “personas” and build content around their specialized needs.
Above all, never stop iterating. Technology and marketing continue to evolve, and with them, customer expectations. Understanding and fulfillment of their needs should occur before they even know what their needs are, and with data and a little marketing savvy, this lofty aspiration can be achieved.
Read more on taking Google Analytics to the next level.